Immigrants from North America vs Polish Single Father Households
COMPARE
Immigrants from North America
Polish
Single Father Households
Single Father Households Comparison
Immigrants from North America
Poles
2.2%
SINGLE FATHER HOUSEHOLDS
98.2/ 100
METRIC RATING
114th/ 347
METRIC RANK
2.2%
SINGLE FATHER HOUSEHOLDS
96.5/ 100
METRIC RATING
132nd/ 347
METRIC RANK
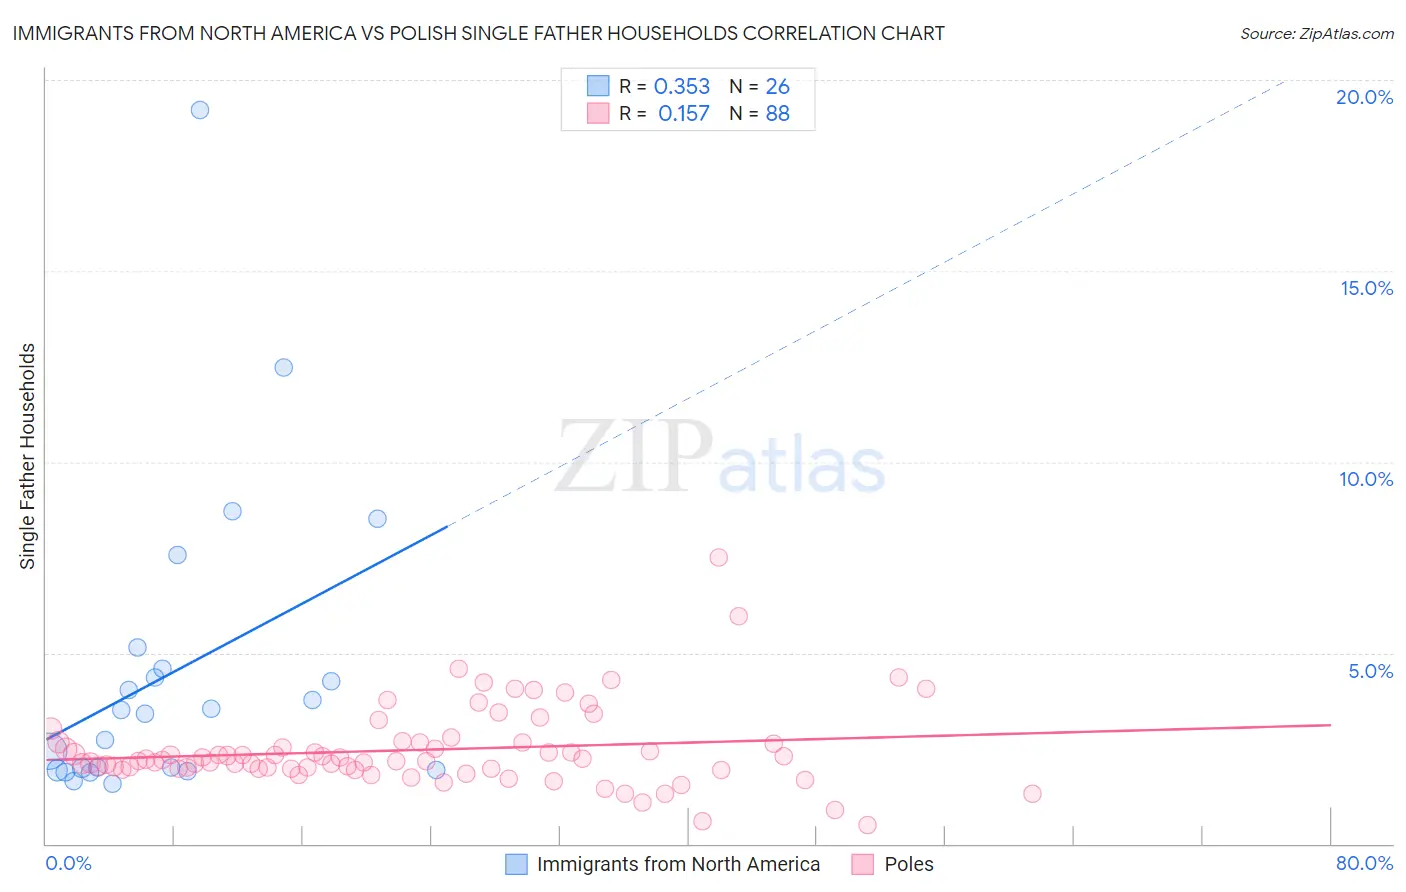
Immigrants from North America vs Polish Single Father Households Correlation Chart
The statistical analysis conducted on geographies consisting of 456,447,919 people shows a mild positive correlation between the proportion of Immigrants from North America and percentage of single father households in the United States with a correlation coefficient (R) of 0.353 and weighted average of 2.2%. Similarly, the statistical analysis conducted on geographies consisting of 546,814,077 people shows a poor positive correlation between the proportion of Poles and percentage of single father households in the United States with a correlation coefficient (R) of 0.157 and weighted average of 2.2%, a difference of 1.3%.
Single Father Households Correlation Summary
| Measurement | Immigrants from North America | Polish |
| Minimum | 1.6% | 0.50% |
| Maximum | 19.2% | 7.5% |
| Range | 17.6% | 7.0% |
| Mean | 4.5% | 2.5% |
| Median | 3.4% | 2.2% |
| Interquartile 25% (IQ1) | 1.9% | 2.0% |
| Interquartile 75% (IQ3) | 4.6% | 2.6% |
| Interquartile Range (IQR) | 2.6% | 0.69% |
| Standard Deviation (Sample) | 4.0% | 1.1% |
| Standard Deviation (Population) | 3.9% | 1.1% |
Demographics Similar to Immigrants from North America and Poles by Single Father Households
In terms of single father households, the demographic groups most similar to Immigrants from North America are Immigrants from Barbados (2.2%, a difference of 0.030%), Iraqi (2.2%, a difference of 0.040%), Immigrants from Argentina (2.2%, a difference of 0.060%), Hungarian (2.2%, a difference of 0.25%), and Immigrants from Morocco (2.2%, a difference of 0.35%). Similarly, the demographic groups most similar to Poles are Immigrants from Jordan (2.2%, a difference of 0.020%), Immigrants from Chile (2.2%, a difference of 0.070%), Taiwanese (2.2%, a difference of 0.12%), Serbian (2.2%, a difference of 0.19%), and Immigrants from England (2.2%, a difference of 0.20%).
| Demographics | Rating | Rank | Single Father Households |
| Iraqis | 98.2 /100 | #113 | Exceptional 2.2% |
| Immigrants | North America | 98.2 /100 | #114 | Exceptional 2.2% |
| Immigrants | Barbados | 98.2 /100 | #115 | Exceptional 2.2% |
| Immigrants | Argentina | 98.1 /100 | #116 | Exceptional 2.2% |
| Hungarians | 97.9 /100 | #117 | Exceptional 2.2% |
| Immigrants | Morocco | 97.8 /100 | #118 | Exceptional 2.2% |
| Trinidadians and Tobagonians | 97.8 /100 | #119 | Exceptional 2.2% |
| Australians | 97.7 /100 | #120 | Exceptional 2.2% |
| Immigrants | Brazil | 97.7 /100 | #121 | Exceptional 2.2% |
| Immigrants | Iraq | 97.6 /100 | #122 | Exceptional 2.2% |
| Immigrants | Yemen | 97.5 /100 | #123 | Exceptional 2.2% |
| British West Indians | 97.4 /100 | #124 | Exceptional 2.2% |
| Immigrants | Indonesia | 97.4 /100 | #125 | Exceptional 2.2% |
| Moroccans | 96.9 /100 | #126 | Exceptional 2.2% |
| Jordanians | 96.9 /100 | #127 | Exceptional 2.2% |
| Immigrants | England | 96.8 /100 | #128 | Exceptional 2.2% |
| Serbians | 96.8 /100 | #129 | Exceptional 2.2% |
| Immigrants | Chile | 96.7 /100 | #130 | Exceptional 2.2% |
| Immigrants | Jordan | 96.6 /100 | #131 | Exceptional 2.2% |
| Poles | 96.5 /100 | #132 | Exceptional 2.2% |
| Taiwanese | 96.3 /100 | #133 | Exceptional 2.2% |