Immigrants from North America vs Guamanian/Chamorro Family Households with Children
COMPARE
Immigrants from North America
Guamanian/Chamorro
Family Households with Children
Family Households with Children Comparison
Immigrants from North America
Guamanians/Chamorros
26.6%
FAMILY HOUSEHOLDS WITH CHILDREN
0.3/ 100
METRIC RATING
283rd/ 347
METRIC RANK
29.7%
FAMILY HOUSEHOLDS WITH CHILDREN
100.0/ 100
METRIC RATING
24th/ 347
METRIC RANK
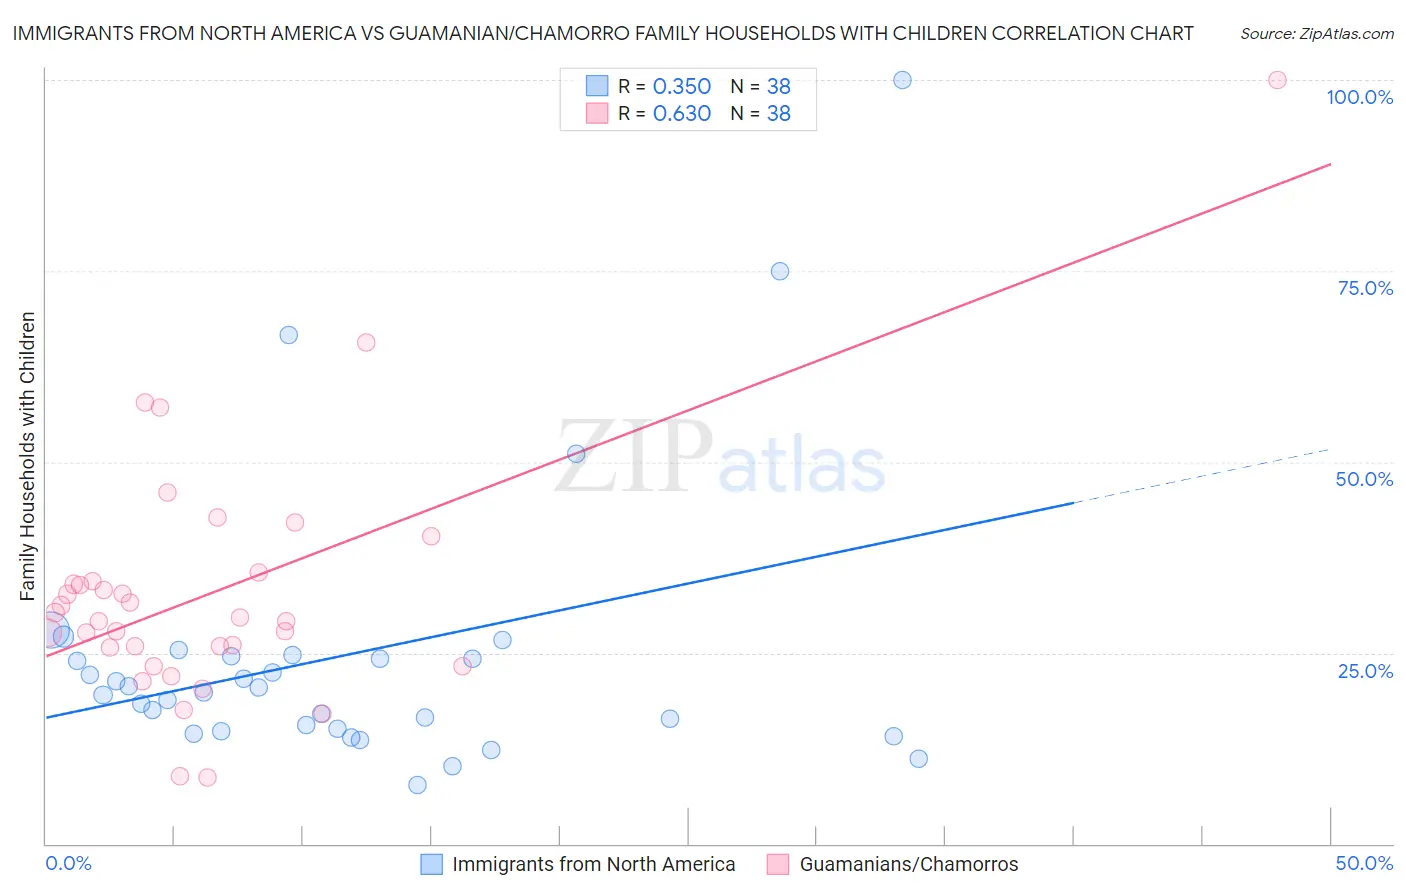
Immigrants from North America vs Guamanian/Chamorro Family Households with Children Correlation Chart
The statistical analysis conducted on geographies consisting of 461,965,747 people shows a mild positive correlation between the proportion of Immigrants from North America and percentage of family households with children in the United States with a correlation coefficient (R) of 0.350 and weighted average of 26.6%. Similarly, the statistical analysis conducted on geographies consisting of 221,827,817 people shows a significant positive correlation between the proportion of Guamanians/Chamorros and percentage of family households with children in the United States with a correlation coefficient (R) of 0.630 and weighted average of 29.7%, a difference of 11.9%.
Family Households with Children Correlation Summary
| Measurement | Immigrants from North America | Guamanian/Chamorro |
| Minimum | 7.6% | 8.6% |
| Maximum | 100.0% | 100.0% |
| Range | 92.4% | 91.4% |
| Mean | 24.6% | 32.8% |
| Median | 20.1% | 29.4% |
| Interquartile 25% (IQ1) | 15.0% | 25.8% |
| Interquartile 75% (IQ3) | 24.6% | 34.4% |
| Interquartile Range (IQR) | 9.6% | 8.7% |
| Standard Deviation (Sample) | 18.5% | 16.3% |
| Standard Deviation (Population) | 18.3% | 16.1% |
Similar Demographics by Family Households with Children
Demographics Similar to Immigrants from North America by Family Households with Children
In terms of family households with children, the demographic groups most similar to Immigrants from North America are Immigrants from Canada (26.5%, a difference of 0.020%), Cambodian (26.5%, a difference of 0.050%), French American Indian (26.6%, a difference of 0.070%), Lithuanian (26.6%, a difference of 0.080%), and Immigrants from Senegal (26.5%, a difference of 0.10%).
| Demographics | Rating | Rank | Family Households with Children |
| Immigrants | Spain | 0.5 /100 | #276 | Tragic 26.6% |
| Celtics | 0.4 /100 | #277 | Tragic 26.6% |
| Immigrants | Europe | 0.4 /100 | #278 | Tragic 26.6% |
| Finns | 0.4 /100 | #279 | Tragic 26.6% |
| Senegalese | 0.4 /100 | #280 | Tragic 26.6% |
| Lithuanians | 0.3 /100 | #281 | Tragic 26.6% |
| French American Indians | 0.3 /100 | #282 | Tragic 26.6% |
| Immigrants | North America | 0.3 /100 | #283 | Tragic 26.6% |
| Immigrants | Canada | 0.3 /100 | #284 | Tragic 26.5% |
| Cambodians | 0.2 /100 | #285 | Tragic 26.5% |
| Immigrants | Senegal | 0.2 /100 | #286 | Tragic 26.5% |
| Shoshone | 0.2 /100 | #287 | Tragic 26.5% |
| Russians | 0.2 /100 | #288 | Tragic 26.5% |
| Immigrants | Sweden | 0.2 /100 | #289 | Tragic 26.5% |
| Albanians | 0.2 /100 | #290 | Tragic 26.5% |
Demographics Similar to Guamanians/Chamorros by Family Households with Children
In terms of family households with children, the demographic groups most similar to Guamanians/Chamorros are Mexican American Indian (29.7%, a difference of 0.10%), Immigrants from Latin America (29.7%, a difference of 0.10%), Malaysian (29.8%, a difference of 0.37%), Immigrants from Laos (29.8%, a difference of 0.41%), and Immigrants from El Salvador (29.8%, a difference of 0.45%).
| Demographics | Rating | Rank | Family Households with Children |
| Hispanics or Latinos | 100.0 /100 | #17 | Exceptional 29.9% |
| Salvadorans | 100.0 /100 | #18 | Exceptional 29.9% |
| Alaska Natives | 100.0 /100 | #19 | Exceptional 29.9% |
| Immigrants | El Salvador | 100.0 /100 | #20 | Exceptional 29.8% |
| Immigrants | Laos | 100.0 /100 | #21 | Exceptional 29.8% |
| Malaysians | 100.0 /100 | #22 | Exceptional 29.8% |
| Mexican American Indians | 100.0 /100 | #23 | Exceptional 29.7% |
| Guamanians/Chamorros | 100.0 /100 | #24 | Exceptional 29.7% |
| Immigrants | Latin America | 100.0 /100 | #25 | Exceptional 29.7% |
| Sri Lankans | 100.0 /100 | #26 | Exceptional 29.5% |
| Immigrants | Vietnam | 100.0 /100 | #27 | Exceptional 29.5% |
| Samoans | 100.0 /100 | #28 | Exceptional 29.5% |
| Bolivians | 100.0 /100 | #29 | Exceptional 29.5% |
| Yuman | 100.0 /100 | #30 | Exceptional 29.5% |
| Japanese | 100.0 /100 | #31 | Exceptional 29.4% |