Immigrants from Netherlands vs Immigrants from Korea Family Households with Children
COMPARE
Immigrants from Netherlands
Immigrants from Korea
Family Households with Children
Family Households with Children Comparison
Immigrants from Netherlands
Immigrants from Korea
26.9%
FAMILY HOUSEHOLDS WITH CHILDREN
3.5/ 100
METRIC RATING
237th/ 347
METRIC RANK
28.5%
FAMILY HOUSEHOLDS WITH CHILDREN
99.9/ 100
METRIC RATING
69th/ 347
METRIC RANK
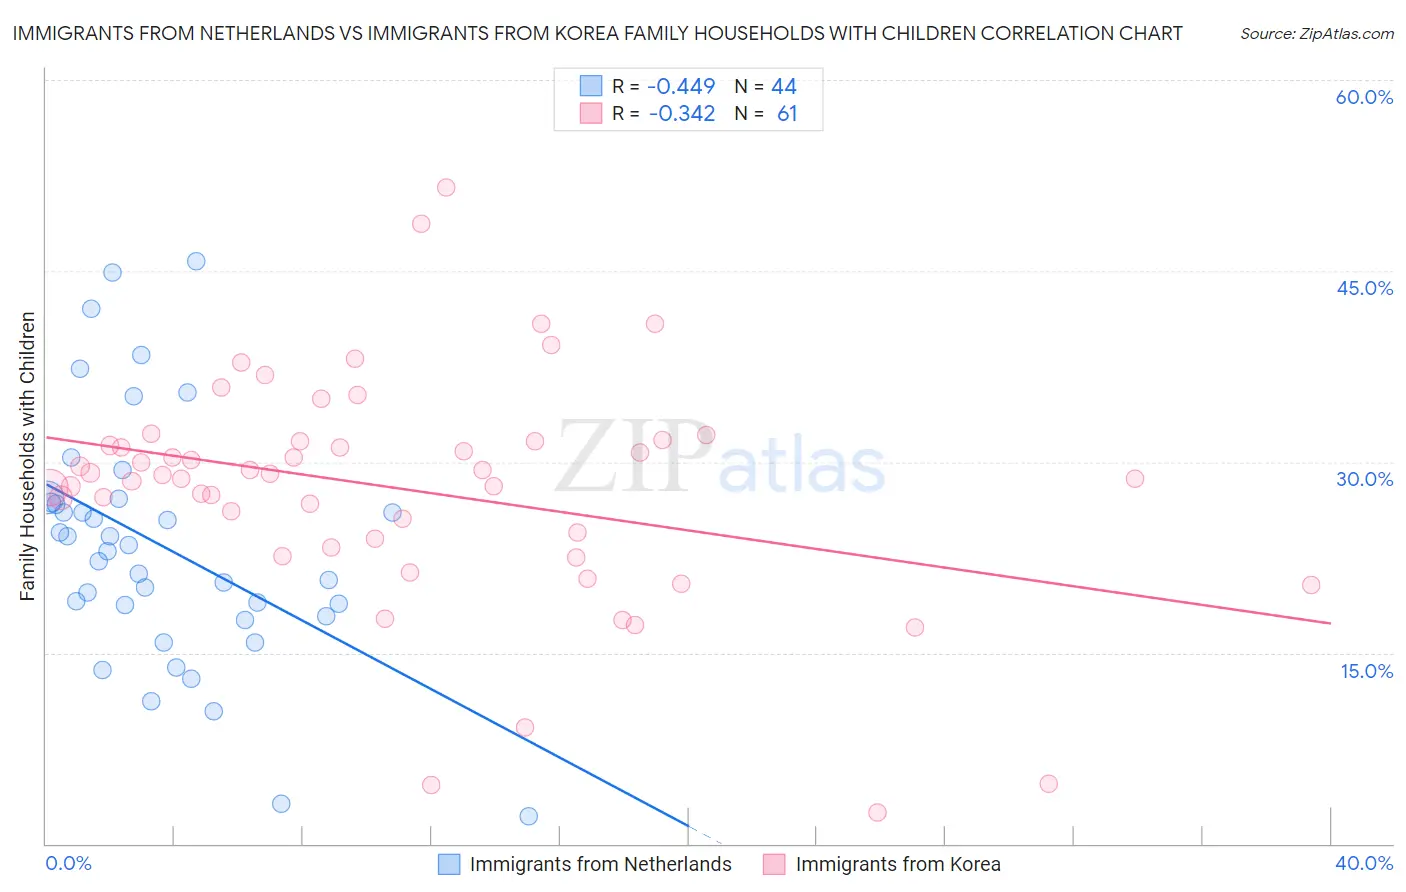
Immigrants from Netherlands vs Immigrants from Korea Family Households with Children Correlation Chart
The statistical analysis conducted on geographies consisting of 237,672,305 people shows a moderate negative correlation between the proportion of Immigrants from Netherlands and percentage of family households with children in the United States with a correlation coefficient (R) of -0.449 and weighted average of 26.9%. Similarly, the statistical analysis conducted on geographies consisting of 415,788,077 people shows a mild negative correlation between the proportion of Immigrants from Korea and percentage of family households with children in the United States with a correlation coefficient (R) of -0.342 and weighted average of 28.5%, a difference of 5.8%.
Family Households with Children Correlation Summary
| Measurement | Immigrants from Netherlands | Immigrants from Korea |
| Minimum | 2.1% | 2.4% |
| Maximum | 45.8% | 51.5% |
| Range | 43.7% | 49.1% |
| Mean | 23.4% | 27.8% |
| Median | 23.2% | 29.0% |
| Interquartile 25% (IQ1) | 18.3% | 23.6% |
| Interquartile 75% (IQ3) | 27.0% | 31.6% |
| Interquartile Range (IQR) | 8.7% | 8.0% |
| Standard Deviation (Sample) | 9.6% | 9.0% |
| Standard Deviation (Population) | 9.5% | 9.0% |
Similar Demographics by Family Households with Children
Demographics Similar to Immigrants from Netherlands by Family Households with Children
In terms of family households with children, the demographic groups most similar to Immigrants from Netherlands are Moroccan (26.9%, a difference of 0.010%), Cape Verdean (26.9%, a difference of 0.020%), Immigrants from Southern Europe (26.9%, a difference of 0.020%), Immigrants from Bulgaria (26.9%, a difference of 0.030%), and Navajo (26.9%, a difference of 0.040%).
| Demographics | Rating | Rank | Family Households with Children |
| Bulgarians | 5.8 /100 | #230 | Tragic 27.0% |
| Luxembourgers | 5.5 /100 | #231 | Tragic 27.0% |
| Yugoslavians | 5.1 /100 | #232 | Tragic 27.0% |
| Immigrants | Italy | 5.0 /100 | #233 | Tragic 27.0% |
| Immigrants | Germany | 4.4 /100 | #234 | Tragic 27.0% |
| Immigrants | Morocco | 4.2 /100 | #235 | Tragic 27.0% |
| Cape Verdeans | 3.6 /100 | #236 | Tragic 26.9% |
| Immigrants | Netherlands | 3.5 /100 | #237 | Tragic 26.9% |
| Moroccans | 3.4 /100 | #238 | Tragic 26.9% |
| Immigrants | Southern Europe | 3.4 /100 | #239 | Tragic 26.9% |
| Immigrants | Bulgaria | 3.3 /100 | #240 | Tragic 26.9% |
| Navajo | 3.2 /100 | #241 | Tragic 26.9% |
| Immigrants | England | 3.2 /100 | #242 | Tragic 26.9% |
| Immigrants | Saudi Arabia | 2.9 /100 | #243 | Tragic 26.9% |
| Ukrainians | 2.9 /100 | #244 | Tragic 26.9% |
Demographics Similar to Immigrants from Korea by Family Households with Children
In terms of family households with children, the demographic groups most similar to Immigrants from Korea are Houma (28.5%, a difference of 0.020%), Honduran (28.5%, a difference of 0.040%), Immigrants from Egypt (28.5%, a difference of 0.040%), Ghanaian (28.5%, a difference of 0.040%), and Immigrants from Honduras (28.5%, a difference of 0.050%).
| Demographics | Rating | Rank | Family Households with Children |
| Egyptians | 99.9 /100 | #62 | Exceptional 28.6% |
| Immigrants | Lebanon | 99.9 /100 | #63 | Exceptional 28.6% |
| Filipinos | 99.9 /100 | #64 | Exceptional 28.6% |
| Hondurans | 99.9 /100 | #65 | Exceptional 28.5% |
| Immigrants | Egypt | 99.9 /100 | #66 | Exceptional 28.5% |
| Ghanaians | 99.9 /100 | #67 | Exceptional 28.5% |
| Houma | 99.9 /100 | #68 | Exceptional 28.5% |
| Immigrants | Korea | 99.9 /100 | #69 | Exceptional 28.5% |
| Immigrants | Honduras | 99.9 /100 | #70 | Exceptional 28.5% |
| Burmese | 99.9 /100 | #71 | Exceptional 28.5% |
| Immigrants | Indonesia | 99.9 /100 | #72 | Exceptional 28.5% |
| Iraqis | 99.9 /100 | #73 | Exceptional 28.5% |
| Laotians | 99.9 /100 | #74 | Exceptional 28.5% |
| Immigrants | Jordan | 99.9 /100 | #75 | Exceptional 28.4% |
| Immigrants | Sri Lanka | 99.9 /100 | #76 | Exceptional 28.4% |