Immigrants from Nepal vs Osage Births to Unmarried Women
COMPARE
Immigrants from Nepal
Osage
Births to Unmarried Women
Births to Unmarried Women Comparison
Immigrants from Nepal
Osage
29.6%
BIRTHS TO UNMARRIED WOMEN
94.3/ 100
METRIC RATING
105th/ 347
METRIC RANK
32.1%
BIRTHS TO UNMARRIED WOMEN
37.1/ 100
METRIC RATING
188th/ 347
METRIC RANK
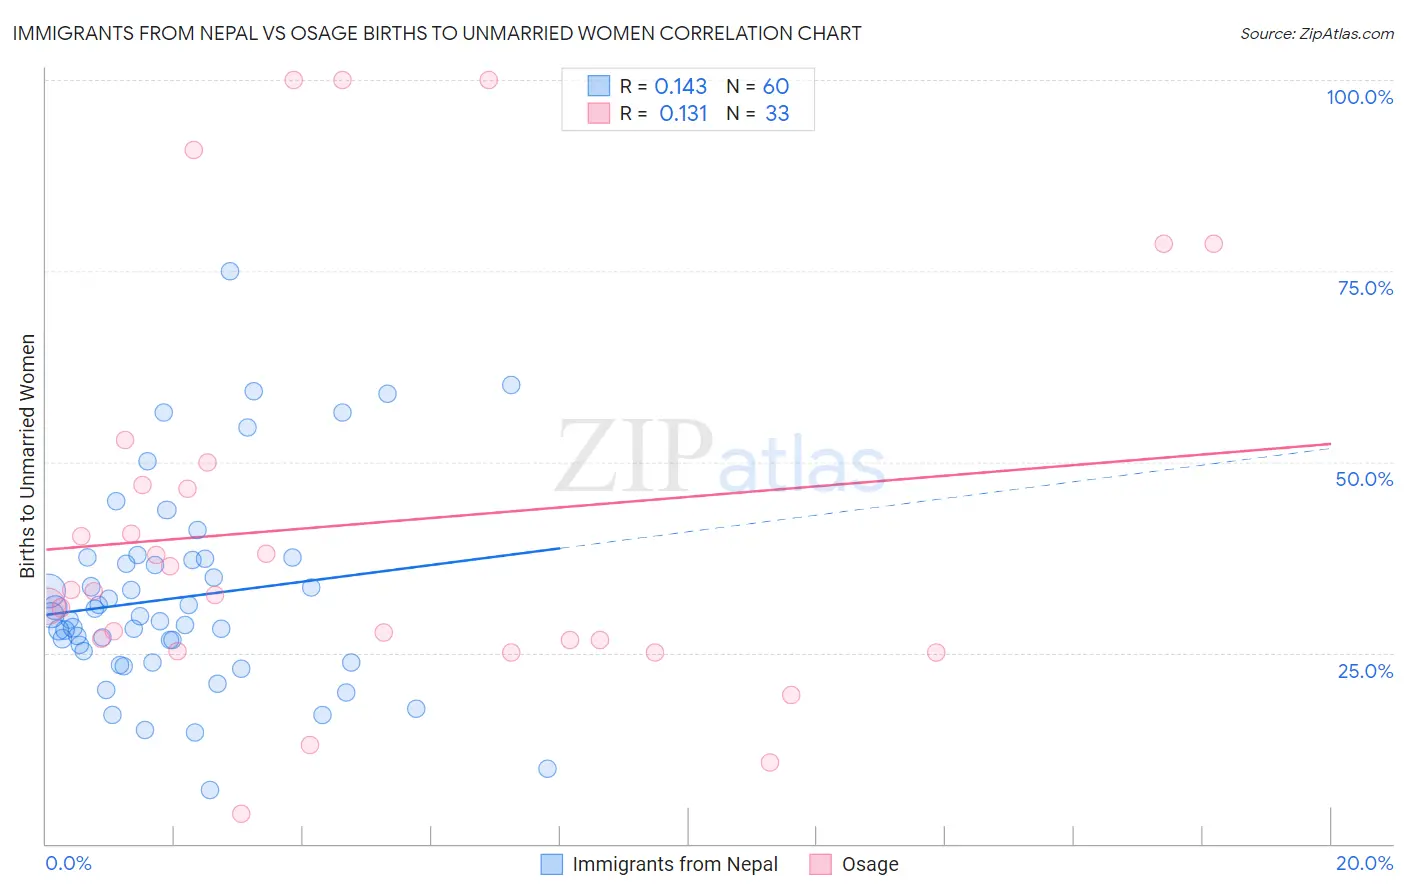
Immigrants from Nepal vs Osage Births to Unmarried Women Correlation Chart
The statistical analysis conducted on geographies consisting of 179,543,863 people shows a poor positive correlation between the proportion of Immigrants from Nepal and percentage of births to unmarried women in the United States with a correlation coefficient (R) of 0.143 and weighted average of 29.6%. Similarly, the statistical analysis conducted on geographies consisting of 89,866,368 people shows a poor positive correlation between the proportion of Osage and percentage of births to unmarried women in the United States with a correlation coefficient (R) of 0.131 and weighted average of 32.1%, a difference of 8.4%.
Births to Unmarried Women Correlation Summary
| Measurement | Immigrants from Nepal | Osage |
| Minimum | 7.1% | 4.0% |
| Maximum | 75.0% | 100.0% |
| Range | 67.9% | 96.0% |
| Mean | 32.2% | 41.9% |
| Median | 29.6% | 33.0% |
| Interquartile 25% (IQ1) | 24.5% | 25.9% |
| Interquartile 75% (IQ3) | 37.3% | 48.4% |
| Interquartile Range (IQR) | 12.8% | 22.5% |
| Standard Deviation (Sample) | 13.2% | 26.2% |
| Standard Deviation (Population) | 13.0% | 25.8% |
Similar Demographics by Births to Unmarried Women
Demographics Similar to Immigrants from Nepal by Births to Unmarried Women
In terms of births to unmarried women, the demographic groups most similar to Immigrants from Nepal are Lithuanian (29.6%, a difference of 0.050%), Lebanese (29.5%, a difference of 0.060%), Australian (29.5%, a difference of 0.11%), Immigrants from Northern Africa (29.5%, a difference of 0.19%), and Swedish (29.6%, a difference of 0.25%).
| Demographics | Rating | Rank | Births to Unmarried Women |
| Immigrants | Syria | 95.7 /100 | #98 | Exceptional 29.4% |
| Immigrants | Denmark | 95.3 /100 | #99 | Exceptional 29.4% |
| Luxembourgers | 95.2 /100 | #100 | Exceptional 29.4% |
| Immigrants | Northern Africa | 94.7 /100 | #101 | Exceptional 29.5% |
| Australians | 94.6 /100 | #102 | Exceptional 29.5% |
| Lebanese | 94.4 /100 | #103 | Exceptional 29.5% |
| Lithuanians | 94.4 /100 | #104 | Exceptional 29.6% |
| Immigrants | Nepal | 94.3 /100 | #105 | Exceptional 29.6% |
| Swedes | 93.8 /100 | #106 | Exceptional 29.6% |
| Immigrants | Brazil | 93.7 /100 | #107 | Exceptional 29.6% |
| Paraguayans | 93.5 /100 | #108 | Exceptional 29.7% |
| Greeks | 93.4 /100 | #109 | Exceptional 29.7% |
| Immigrants | Ethiopia | 93.4 /100 | #110 | Exceptional 29.7% |
| Immigrants | Hungary | 93.0 /100 | #111 | Exceptional 29.7% |
| Basques | 93.0 /100 | #112 | Exceptional 29.7% |
Demographics Similar to Osage by Births to Unmarried Women
In terms of births to unmarried women, the demographic groups most similar to Osage are Immigrants from Kenya (32.1%, a difference of 0.030%), Czechoslovakian (32.0%, a difference of 0.090%), Welsh (32.0%, a difference of 0.11%), German (32.0%, a difference of 0.23%), and Immigrants from South America (32.0%, a difference of 0.35%).
| Demographics | Rating | Rank | Births to Unmarried Women |
| Immigrants | Peru | 45.1 /100 | #181 | Average 31.8% |
| Kenyans | 43.0 /100 | #182 | Average 31.9% |
| Canadians | 41.4 /100 | #183 | Average 31.9% |
| Immigrants | South America | 40.7 /100 | #184 | Average 32.0% |
| Germans | 39.5 /100 | #185 | Fair 32.0% |
| Welsh | 38.2 /100 | #186 | Fair 32.0% |
| Czechoslovakians | 38.0 /100 | #187 | Fair 32.0% |
| Osage | 37.1 /100 | #188 | Fair 32.1% |
| Immigrants | Kenya | 36.9 /100 | #189 | Fair 32.1% |
| Tlingit-Haida | 32.6 /100 | #190 | Fair 32.2% |
| Irish | 32.4 /100 | #191 | Fair 32.2% |
| Colombians | 31.9 /100 | #192 | Fair 32.2% |
| Fijians | 31.1 /100 | #193 | Fair 32.3% |
| Sudanese | 27.3 /100 | #194 | Fair 32.4% |
| Samoans | 21.9 /100 | #195 | Fair 32.6% |