Immigrants from Nepal vs Immigrants from Greece Single Mother Households
COMPARE
Immigrants from Nepal
Immigrants from Greece
Single Mother Households
Single Mother Households Comparison
Immigrants from Nepal
Immigrants from Greece
6.4%
SINGLE MOTHER HOUSEHOLDS
36.1/ 100
METRIC RATING
180th/ 347
METRIC RANK
5.4%
SINGLE MOTHER HOUSEHOLDS
99.5/ 100
METRIC RATING
41st/ 347
METRIC RANK
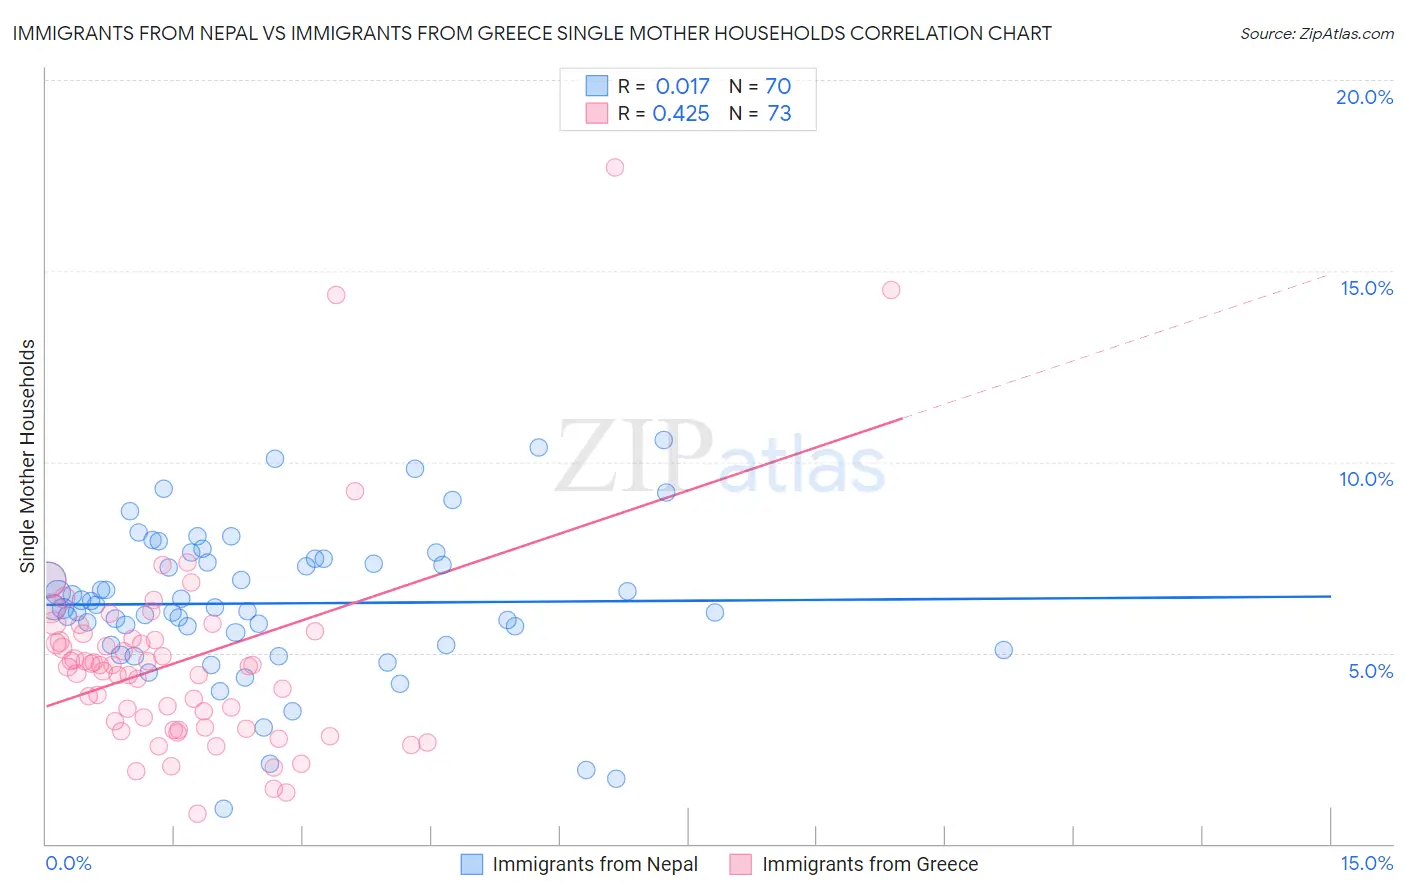
Immigrants from Nepal vs Immigrants from Greece Single Mother Households Correlation Chart
The statistical analysis conducted on geographies consisting of 186,604,870 people shows no correlation between the proportion of Immigrants from Nepal and percentage of single mother households in the United States with a correlation coefficient (R) of 0.017 and weighted average of 6.4%. Similarly, the statistical analysis conducted on geographies consisting of 216,428,324 people shows a moderate positive correlation between the proportion of Immigrants from Greece and percentage of single mother households in the United States with a correlation coefficient (R) of 0.425 and weighted average of 5.4%, a difference of 18.9%.
Single Mother Households Correlation Summary
| Measurement | Immigrants from Nepal | Immigrants from Greece |
| Minimum | 0.90% | 0.80% |
| Maximum | 10.6% | 17.7% |
| Range | 9.7% | 16.9% |
| Mean | 6.3% | 4.8% |
| Median | 6.2% | 4.7% |
| Interquartile 25% (IQ1) | 5.2% | 3.0% |
| Interquartile 75% (IQ3) | 7.5% | 5.4% |
| Interquartile Range (IQR) | 2.2% | 2.4% |
| Standard Deviation (Sample) | 1.9% | 2.7% |
| Standard Deviation (Population) | 1.9% | 2.7% |
Similar Demographics by Single Mother Households
Demographics Similar to Immigrants from Nepal by Single Mother Households
In terms of single mother households, the demographic groups most similar to Immigrants from Nepal are Spanish (6.4%, a difference of 0.32%), South American Indian (6.4%, a difference of 0.32%), Hmong (6.4%, a difference of 0.43%), Portuguese (6.4%, a difference of 0.45%), and Osage (6.4%, a difference of 0.79%).
| Demographics | Rating | Rank | Single Mother Households |
| Immigrants | Vietnam | 51.5 /100 | #173 | Average 6.3% |
| Immigrants | Morocco | 50.0 /100 | #174 | Average 6.3% |
| Marshallese | 45.8 /100 | #175 | Average 6.3% |
| Immigrants | Bosnia and Herzegovina | 44.3 /100 | #176 | Average 6.3% |
| Osage | 43.0 /100 | #177 | Average 6.4% |
| Portuguese | 40.0 /100 | #178 | Fair 6.4% |
| Hmong | 39.8 /100 | #179 | Fair 6.4% |
| Immigrants | Nepal | 36.1 /100 | #180 | Fair 6.4% |
| Spanish | 33.4 /100 | #181 | Fair 6.4% |
| South American Indians | 33.4 /100 | #182 | Fair 6.4% |
| Spaniards | 27.8 /100 | #183 | Fair 6.5% |
| Ethiopians | 26.0 /100 | #184 | Fair 6.5% |
| Ugandans | 25.6 /100 | #185 | Fair 6.5% |
| Costa Ricans | 24.8 /100 | #186 | Fair 6.5% |
| Immigrants | Afghanistan | 24.7 /100 | #187 | Fair 6.5% |
Demographics Similar to Immigrants from Greece by Single Mother Households
In terms of single mother households, the demographic groups most similar to Immigrants from Greece are Macedonian (5.4%, a difference of 0.080%), Immigrants from South Central Asia (5.4%, a difference of 0.14%), Estonian (5.4%, a difference of 0.42%), Immigrants from Sweden (5.4%, a difference of 0.53%), and Immigrants from Serbia (5.4%, a difference of 0.67%).
| Demographics | Rating | Rank | Single Mother Households |
| Bulgarians | 99.7 /100 | #34 | Exceptional 5.3% |
| Immigrants | Northern Europe | 99.7 /100 | #35 | Exceptional 5.3% |
| Immigrants | Czechoslovakia | 99.7 /100 | #36 | Exceptional 5.3% |
| Immigrants | Belgium | 99.7 /100 | #37 | Exceptional 5.3% |
| Immigrants | Serbia | 99.6 /100 | #38 | Exceptional 5.4% |
| Immigrants | Sweden | 99.6 /100 | #39 | Exceptional 5.4% |
| Estonians | 99.6 /100 | #40 | Exceptional 5.4% |
| Immigrants | Greece | 99.5 /100 | #41 | Exceptional 5.4% |
| Macedonians | 99.5 /100 | #42 | Exceptional 5.4% |
| Immigrants | South Central Asia | 99.5 /100 | #43 | Exceptional 5.4% |
| Lithuanians | 99.4 /100 | #44 | Exceptional 5.4% |
| Immigrants | Croatia | 99.4 /100 | #45 | Exceptional 5.4% |
| Croatians | 99.3 /100 | #46 | Exceptional 5.5% |
| Norwegians | 99.3 /100 | #47 | Exceptional 5.5% |
| Turks | 99.2 /100 | #48 | Exceptional 5.5% |