Immigrants from Morocco vs Mexican American Indian Average Family Size
COMPARE
Immigrants from Morocco
Mexican American Indian
Average Family Size
Average Family Size Comparison
Immigrants from Morocco
Mexican American Indians
3.21
AVERAGE FAMILY SIZE
18.5/ 100
METRIC RATING
201st/ 347
METRIC RANK
3.43
AVERAGE FAMILY SIZE
100.0/ 100
METRIC RATING
27th/ 347
METRIC RANK
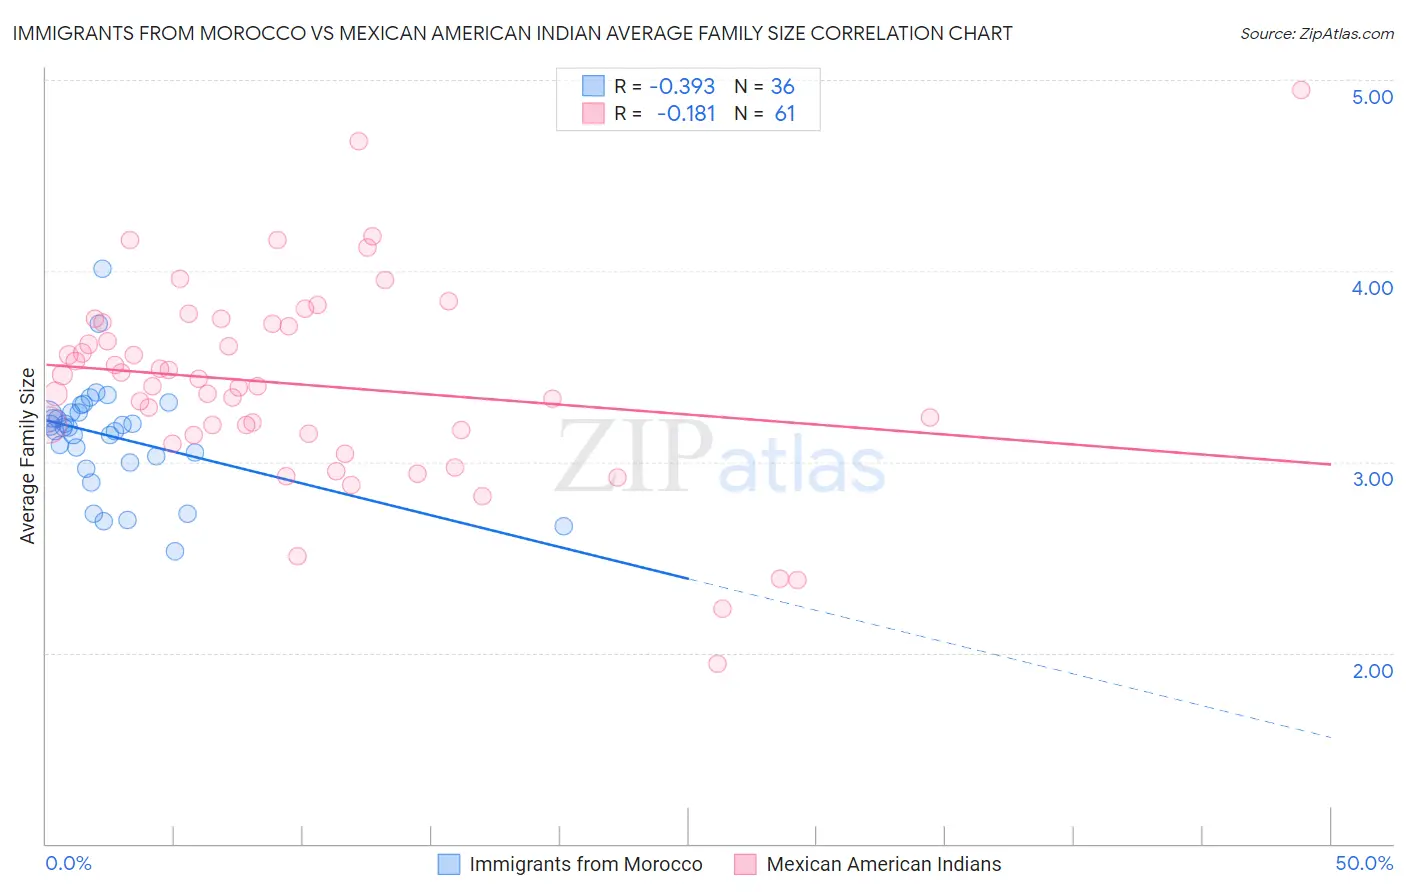
Immigrants from Morocco vs Mexican American Indian Average Family Size Correlation Chart
The statistical analysis conducted on geographies consisting of 178,909,598 people shows a mild negative correlation between the proportion of Immigrants from Morocco and average family size in the United States with a correlation coefficient (R) of -0.393 and weighted average of 3.21. Similarly, the statistical analysis conducted on geographies consisting of 317,496,069 people shows a poor negative correlation between the proportion of Mexican American Indians and average family size in the United States with a correlation coefficient (R) of -0.181 and weighted average of 3.43, a difference of 6.9%.
Average Family Size Correlation Summary
| Measurement | Immigrants from Morocco | Mexican American Indian |
| Minimum | 2.53 | 1.94 |
| Maximum | 4.01 | 4.95 |
| Range | 1.48 | 3.01 |
| Mean | 3.13 | 3.40 |
| Median | 3.18 | 3.40 |
| Interquartile 25% (IQ1) | 3.02 | 3.15 |
| Interquartile 75% (IQ3) | 3.26 | 3.73 |
| Interquartile Range (IQR) | 0.24 | 0.58 |
| Standard Deviation (Sample) | 0.29 | 0.53 |
| Standard Deviation (Population) | 0.28 | 0.53 |
Similar Demographics by Average Family Size
Demographics Similar to Immigrants from Morocco by Average Family Size
In terms of average family size, the demographic groups most similar to Immigrants from Morocco are Immigrants from India (3.21, a difference of 0.0%), Immigrants from Nepal (3.21, a difference of 0.010%), Immigrants from Kenya (3.21, a difference of 0.020%), Hmong (3.21, a difference of 0.060%), and Immigrants from Poland (3.20, a difference of 0.060%).
| Demographics | Rating | Rank | Average Family Size |
| Immigrants | Sudan | 29.1 /100 | #194 | Fair 3.22 |
| Choctaw | 28.3 /100 | #195 | Fair 3.21 |
| Senegalese | 28.2 /100 | #196 | Fair 3.21 |
| Kenyans | 28.0 /100 | #197 | Fair 3.21 |
| Immigrants | Azores | 21.7 /100 | #198 | Fair 3.21 |
| Hmong | 20.7 /100 | #199 | Fair 3.21 |
| Immigrants | Kenya | 19.2 /100 | #200 | Poor 3.21 |
| Immigrants | Morocco | 18.5 /100 | #201 | Poor 3.21 |
| Immigrants | India | 18.5 /100 | #202 | Poor 3.21 |
| Immigrants | Nepal | 18.1 /100 | #203 | Poor 3.21 |
| Immigrants | Poland | 16.6 /100 | #204 | Poor 3.20 |
| Paraguayans | 16.3 /100 | #205 | Poor 3.20 |
| Immigrants | Cabo Verde | 16.0 /100 | #206 | Poor 3.20 |
| Filipinos | 13.6 /100 | #207 | Poor 3.20 |
| Chippewa | 13.3 /100 | #208 | Poor 3.20 |
Demographics Similar to Mexican American Indians by Average Family Size
In terms of average family size, the demographic groups most similar to Mexican American Indians are Native Hawaiian (3.43, a difference of 0.010%), Immigrants from Latin America (3.42, a difference of 0.12%), Nepalese (3.42, a difference of 0.21%), Samoan (3.42, a difference of 0.24%), and Central American (3.41, a difference of 0.44%).
| Demographics | Rating | Rank | Average Family Size |
| Cheyenne | 100.0 /100 | #20 | Exceptional 3.47 |
| Yuman | 100.0 /100 | #21 | Exceptional 3.47 |
| Apache | 100.0 /100 | #22 | Exceptional 3.46 |
| Immigrants | Fiji | 100.0 /100 | #23 | Exceptional 3.45 |
| Natives/Alaskans | 100.0 /100 | #24 | Exceptional 3.45 |
| Yakama | 100.0 /100 | #25 | Exceptional 3.45 |
| Native Hawaiians | 100.0 /100 | #26 | Exceptional 3.43 |
| Mexican American Indians | 100.0 /100 | #27 | Exceptional 3.43 |
| Immigrants | Latin America | 100.0 /100 | #28 | Exceptional 3.42 |
| Nepalese | 100.0 /100 | #29 | Exceptional 3.42 |
| Samoans | 100.0 /100 | #30 | Exceptional 3.42 |
| Central Americans | 100.0 /100 | #31 | Exceptional 3.41 |
| Immigrants | Guatemala | 100.0 /100 | #32 | Exceptional 3.41 |
| Hawaiians | 100.0 /100 | #33 | Exceptional 3.41 |
| Hispanics or Latinos | 100.0 /100 | #34 | Exceptional 3.41 |