Immigrants from Morocco vs Belgian Single Father Households
COMPARE
Immigrants from Morocco
Belgian
Single Father Households
Single Father Households Comparison
Immigrants from Morocco
Belgians
2.2%
SINGLE FATHER HOUSEHOLDS
97.8/ 100
METRIC RATING
118th/ 347
METRIC RANK
2.3%
SINGLE FATHER HOUSEHOLDS
43.3/ 100
METRIC RATING
182nd/ 347
METRIC RANK
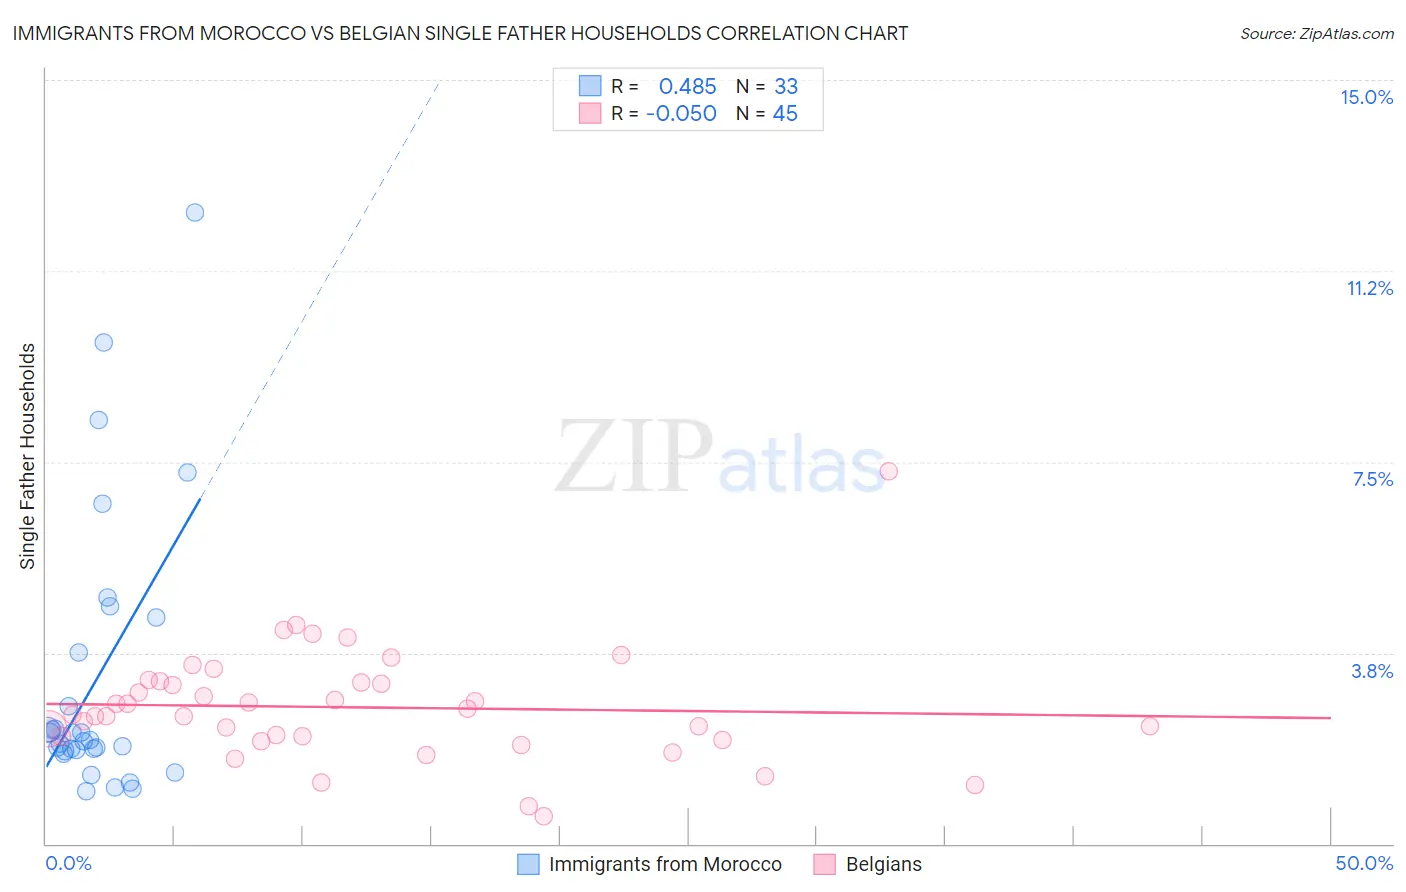
Immigrants from Morocco vs Belgian Single Father Households Correlation Chart
The statistical analysis conducted on geographies consisting of 178,475,316 people shows a moderate positive correlation between the proportion of Immigrants from Morocco and percentage of single father households in the United States with a correlation coefficient (R) of 0.485 and weighted average of 2.2%. Similarly, the statistical analysis conducted on geographies consisting of 352,865,149 people shows a slight negative correlation between the proportion of Belgians and percentage of single father households in the United States with a correlation coefficient (R) of -0.050 and weighted average of 2.3%, a difference of 8.1%.
Single Father Households Correlation Summary
| Measurement | Immigrants from Morocco | Belgian |
| Minimum | 1.0% | 0.55% |
| Maximum | 12.4% | 7.3% |
| Range | 11.4% | 6.8% |
| Mean | 3.2% | 2.7% |
| Median | 2.0% | 2.5% |
| Interquartile 25% (IQ1) | 1.8% | 2.1% |
| Interquartile 75% (IQ3) | 4.1% | 3.2% |
| Interquartile Range (IQR) | 2.3% | 1.1% |
| Standard Deviation (Sample) | 2.7% | 1.1% |
| Standard Deviation (Population) | 2.7% | 1.1% |
Similar Demographics by Single Father Households
Demographics Similar to Immigrants from Morocco by Single Father Households
In terms of single father households, the demographic groups most similar to Immigrants from Morocco are Trinidadian and Tobagonian (2.2%, a difference of 0.060%), Australian (2.2%, a difference of 0.090%), Immigrants from Brazil (2.2%, a difference of 0.090%), Hungarian (2.2%, a difference of 0.10%), and Immigrants from Iraq (2.2%, a difference of 0.19%).
| Demographics | Rating | Rank | Single Father Households |
| Immigrants | Canada | 98.3 /100 | #111 | Exceptional 2.2% |
| Immigrants | Trinidad and Tobago | 98.2 /100 | #112 | Exceptional 2.2% |
| Iraqis | 98.2 /100 | #113 | Exceptional 2.2% |
| Immigrants | North America | 98.2 /100 | #114 | Exceptional 2.2% |
| Immigrants | Barbados | 98.2 /100 | #115 | Exceptional 2.2% |
| Immigrants | Argentina | 98.1 /100 | #116 | Exceptional 2.2% |
| Hungarians | 97.9 /100 | #117 | Exceptional 2.2% |
| Immigrants | Morocco | 97.8 /100 | #118 | Exceptional 2.2% |
| Trinidadians and Tobagonians | 97.8 /100 | #119 | Exceptional 2.2% |
| Australians | 97.7 /100 | #120 | Exceptional 2.2% |
| Immigrants | Brazil | 97.7 /100 | #121 | Exceptional 2.2% |
| Immigrants | Iraq | 97.6 /100 | #122 | Exceptional 2.2% |
| Immigrants | Yemen | 97.5 /100 | #123 | Exceptional 2.2% |
| British West Indians | 97.4 /100 | #124 | Exceptional 2.2% |
| Immigrants | Indonesia | 97.4 /100 | #125 | Exceptional 2.2% |
Demographics Similar to Belgians by Single Father Households
In terms of single father households, the demographic groups most similar to Belgians are Jamaican (2.3%, a difference of 0.020%), Yugoslavian (2.3%, a difference of 0.040%), Costa Rican (2.3%, a difference of 0.060%), Welsh (2.3%, a difference of 0.060%), and Immigrants from Panama (2.4%, a difference of 0.11%).
| Demographics | Rating | Rank | Single Father Households |
| Immigrants | Jamaica | 49.1 /100 | #175 | Average 2.3% |
| Danes | 48.2 /100 | #176 | Average 2.3% |
| Colombians | 48.0 /100 | #177 | Average 2.3% |
| Costa Ricans | 44.1 /100 | #178 | Average 2.3% |
| Welsh | 44.0 /100 | #179 | Average 2.3% |
| Yugoslavians | 43.9 /100 | #180 | Average 2.3% |
| Jamaicans | 43.5 /100 | #181 | Average 2.3% |
| Belgians | 43.3 /100 | #182 | Average 2.3% |
| Immigrants | Panama | 41.8 /100 | #183 | Average 2.4% |
| Sri Lankans | 41.8 /100 | #184 | Average 2.4% |
| Nigerians | 41.0 /100 | #185 | Average 2.4% |
| Immigrants | Bosnia and Herzegovina | 40.4 /100 | #186 | Average 2.4% |
| Immigrants | Colombia | 34.0 /100 | #187 | Fair 2.4% |
| Hmong | 33.0 /100 | #188 | Fair 2.4% |
| U.S. Virgin Islanders | 31.8 /100 | #189 | Fair 2.4% |