Immigrants from Latvia vs Uruguayan Currently Married
COMPARE
Immigrants from Latvia
Uruguayan
Currently Married
Currently Married Comparison
Immigrants from Latvia
Uruguayans
46.7%
CURRENTLY MARRIED
56.7/ 100
METRIC RATING
170th/ 347
METRIC RANK
45.6%
CURRENTLY MARRIED
7.9/ 100
METRIC RATING
210th/ 347
METRIC RANK
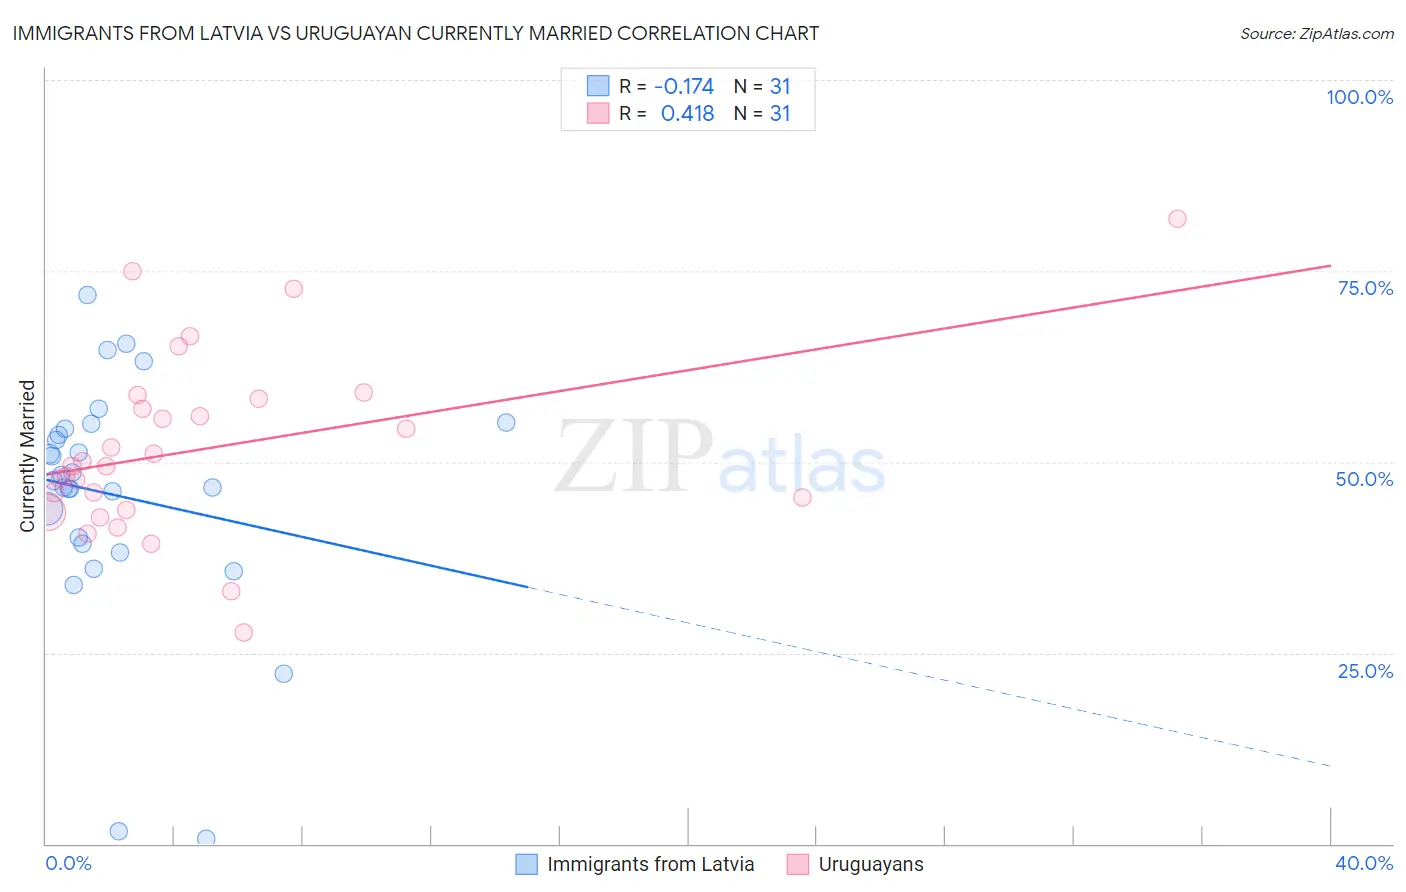
Immigrants from Latvia vs Uruguayan Currently Married Correlation Chart
The statistical analysis conducted on geographies consisting of 113,738,689 people shows a poor negative correlation between the proportion of Immigrants from Latvia and percentage of population currently married in the United States with a correlation coefficient (R) of -0.174 and weighted average of 46.7%. Similarly, the statistical analysis conducted on geographies consisting of 144,776,099 people shows a moderate positive correlation between the proportion of Uruguayans and percentage of population currently married in the United States with a correlation coefficient (R) of 0.418 and weighted average of 45.6%, a difference of 2.5%.
Currently Married Correlation Summary
| Measurement | Immigrants from Latvia | Uruguayan |
| Minimum | 0.60% | 27.6% |
| Maximum | 71.8% | 81.8% |
| Range | 71.2% | 54.2% |
| Mean | 45.6% | 51.8% |
| Median | 47.6% | 49.5% |
| Interquartile 25% (IQ1) | 39.3% | 43.7% |
| Interquartile 75% (IQ3) | 54.3% | 58.2% |
| Interquartile Range (IQR) | 15.0% | 14.6% |
| Standard Deviation (Sample) | 15.6% | 11.8% |
| Standard Deviation (Population) | 15.4% | 11.6% |
Similar Demographics by Currently Married
Demographics Similar to Immigrants from Latvia by Currently Married
In terms of currently married, the demographic groups most similar to Immigrants from Latvia are Armenian (46.8%, a difference of 0.050%), Immigrants from Afghanistan (46.8%, a difference of 0.060%), Spaniard (46.8%, a difference of 0.080%), Immigrants from Syria (46.8%, a difference of 0.10%), and Samoan (46.8%, a difference of 0.11%).
| Demographics | Rating | Rank | Currently Married |
| Delaware | 64.7 /100 | #163 | Good 46.9% |
| Immigrants | Western Asia | 64.2 /100 | #164 | Good 46.9% |
| Samoans | 59.8 /100 | #165 | Average 46.8% |
| Immigrants | Syria | 59.3 /100 | #166 | Average 46.8% |
| Spaniards | 58.8 /100 | #167 | Average 46.8% |
| Immigrants | Afghanistan | 58.2 /100 | #168 | Average 46.8% |
| Armenians | 58.2 /100 | #169 | Average 46.8% |
| Immigrants | Latvia | 56.7 /100 | #170 | Average 46.7% |
| Immigrants | Zimbabwe | 52.4 /100 | #171 | Average 46.7% |
| Aleuts | 52.0 /100 | #172 | Average 46.7% |
| Tlingit-Haida | 51.2 /100 | #173 | Average 46.7% |
| Peruvians | 50.0 /100 | #174 | Average 46.6% |
| Immigrants | Brazil | 49.9 /100 | #175 | Average 46.6% |
| Hawaiians | 48.6 /100 | #176 | Average 46.6% |
| Israelis | 48.6 /100 | #177 | Average 46.6% |
Demographics Similar to Uruguayans by Currently Married
In terms of currently married, the demographic groups most similar to Uruguayans are Houma (45.5%, a difference of 0.090%), Marshallese (45.5%, a difference of 0.090%), Immigrants from Micronesia (45.6%, a difference of 0.11%), Alaska Native (45.5%, a difference of 0.12%), and Dutch West Indian (45.5%, a difference of 0.16%).
| Demographics | Rating | Rank | Currently Married |
| Taiwanese | 11.7 /100 | #203 | Poor 45.8% |
| Immigrants | Spain | 11.6 /100 | #204 | Poor 45.8% |
| South American Indians | 11.5 /100 | #205 | Poor 45.8% |
| Immigrants | Immigrants | 11.2 /100 | #206 | Poor 45.8% |
| Immigrants | South America | 10.8 /100 | #207 | Poor 45.7% |
| Alsatians | 10.8 /100 | #208 | Poor 45.7% |
| Immigrants | Micronesia | 8.8 /100 | #209 | Tragic 45.6% |
| Uruguayans | 7.9 /100 | #210 | Tragic 45.6% |
| Houma | 7.2 /100 | #211 | Tragic 45.5% |
| Marshallese | 7.2 /100 | #212 | Tragic 45.5% |
| Alaska Natives | 7.0 /100 | #213 | Tragic 45.5% |
| Dutch West Indians | 6.7 /100 | #214 | Tragic 45.5% |
| German Russians | 6.7 /100 | #215 | Tragic 45.5% |
| Immigrants | Morocco | 5.5 /100 | #216 | Tragic 45.4% |
| Immigrants | Thailand | 5.1 /100 | #217 | Tragic 45.4% |