Immigrants from Latin America vs Native/Alaskan Currently Married

COMPARE

Immigrants from Latin America
Race
Ancestry
AfghanAfricanAlaska NativeAlaskan AthabascanAlbanianAleutAlsatianAmericanApacheArabArapahoArgentineanArmenianAssyrian/Chaldean/SyriacAustralianAustrianBahamianBangladeshiBarbadianBasqueBelgianBelizeanBermudanBhutaneseBlackfeetBolivianBrazilianBritishBritish West IndianBulgarianBurmeseCajunCambodianCanadianCape VerdeanCarpatho RusynCelticCentral AmericanCentral American IndianCherokeeCheyenneChickasawChileanChineseChippewaChoctawColombianColvilleComancheCosta RicanCreeCreekCroatianCrowCubanCypriotCzechCzechoslovakianDanishDelawareDominicanDutchDutch West IndianEastern EuropeanEcuadorianEgyptianEnglishEstonianEthiopianEuropeanFijianFilipinoFinnishFrenchFrench American IndianFrench CanadianGermanGerman RussianGhanaianGreekGuamanian/ChamorroGuatemalanGuyaneseHaitianHmongHonduranHopiHoumaHungarianIcelanderIndian (Asian)IndonesianInupiatIranianIraqiIrishIroquoisIsraeliItalianJamaicanJapaneseJordanianKenyanKiowaKoreanLaotianLatvianLebaneseLiberianLithuanianLumbeeLuxembourgerMacedonianMalaysianMalteseMarshalleseMenomineeMexicanMexican American IndianMongolianMoroccanNative HawaiianNavajoNepaleseNew ZealanderNicaraguanNigerianNorthern EuropeanNorwegianOkinawanOsageOttawaPaiutePakistaniPalestinianPanamanianParaguayanPennsylvania GermanPeruvianPimaPolishPortuguesePotawatomiPuebloPuerto RicanPuget Sound SalishRomanianRussianSalvadoranSamoanScandinavianScotch-IrishScottishSeminoleSenegaleseSerbianShoshoneSierra LeoneanSiouxSlavicSlovakSloveneSomaliSouth AfricanSouth AmericanSouth American IndianSoviet UnionSpaniardSpanishSpanish AmericanSpanish American IndianSri LankanSubsaharan AfricanSudaneseSwedishSwissSyrianTaiwaneseThaiTlingit-HaidaTohono O'OdhamTonganTrinidadian and TobagonianTsimshianTurkishU.S. Virgin IslanderUgandanUkrainianUruguayanUteVenezuelanVietnameseWelshWest IndianYakamaYaquiYugoslavianYumanYup'ikZimbabwean
Immigration
NonimmigrantsImmigrantsAfghanistanAfricaAlbaniaArgentinaArmeniaAsiaAustraliaAustriaBahamasBangladeshBarbadosBelarusBelgiumBelizeBoliviaBosnia and HerzegovinaBrazilBulgariaBurma/MyanmarCabo VerdeCambodiaCameroonCanadaCaribbeanCentral AmericaChileChinaColombiaCongoCosta RicaCroatiaCubaCzechoslovakiaDenmarkDominicaDominican RepublicEastern AfricaEastern AsiaEastern EuropeEcuadorEgyptEl SalvadorEnglandEritreaEthiopiaEuropeFijiFranceGermanyGhanaGreeceGrenadaGuatemalaGuyanaHaitiHondurasHong KongHungaryIndiaIndonesiaIranIraqIrelandIsraelItalyJamaicaJapanJordanKazakhstanKenyaKoreaKuwaitLaosLatin AmericaLatviaLebanonLiberiaLithuaniaMalaysiaMexicoMicronesiaMiddle AfricaMoldovaMoroccoNepalNetherlandsNicaraguaNigeriaNorth AmericaNorth MacedoniaNorthern AfricaNorthern EuropeNorwayOceaniaPakistanPanamaPeruPhilippinesPolandPortugalRomaniaRussiaSaudi ArabiaScotlandSenegalSerbiaSierra LeoneSingaporeSomaliaSouth AfricaSouth AmericaSouth Central AsiaSouth Eastern AsiaSouthern EuropeSpainSri LankaSt. Vincent and the GrenadinesSudanSwedenSwitzerlandSyriaTaiwanThailandTrinidad and TobagoTurkeyUgandaUkraineUruguayUzbekistanVenezuelaVietnamWest IndiesWestern AfricaWestern AsiaWestern EuropeYemenZaireZimbabweAzores
Native/Alaskan
Race
Ancestry
AfghanAfricanAlaska NativeAlaskan AthabascanAlbanianAleutAlsatianAmericanApacheArabArapahoArgentineanArmenianAssyrian/Chaldean/SyriacAustralianAustrianBahamianBangladeshiBarbadianBasqueBelgianBelizeanBermudanBhutaneseBlackfeetBolivianBrazilianBritishBritish West IndianBulgarianBurmeseCajunCambodianCanadianCape VerdeanCarpatho RusynCelticCentral AmericanCentral American IndianCherokeeCheyenneChickasawChileanChineseChippewaChoctawColombianColvilleComancheCosta RicanCreeCreekCroatianCrowCubanCypriotCzechCzechoslovakianDanishDelawareDominicanDutchDutch West IndianEastern EuropeanEcuadorianEgyptianEnglishEstonianEthiopianEuropeanFijianFilipinoFinnishFrenchFrench American IndianFrench CanadianGermanGerman RussianGhanaianGreekGuamanian/ChamorroGuatemalanGuyaneseHaitianHmongHonduranHopiHoumaHungarianIcelanderIndian (Asian)IndonesianInupiatIranianIraqiIrishIroquoisIsraeliItalianJamaicanJapaneseJordanianKenyanKiowaKoreanLaotianLatvianLebaneseLiberianLithuanianLumbeeLuxembourgerMacedonianMalaysianMalteseMarshalleseMenomineeMexicanMexican American IndianMongolianMoroccanNative HawaiianNavajoNepaleseNew ZealanderNicaraguanNigerianNorthern EuropeanNorwegianOkinawanOsageOttawaPaiutePakistaniPalestinianPanamanianParaguayanPennsylvania GermanPeruvianPimaPolishPortuguesePotawatomiPuebloPuerto RicanPuget Sound SalishRomanianRussianSalvadoranSamoanScandinavianScotch-IrishScottishSeminoleSenegaleseSerbianShoshoneSierra LeoneanSiouxSlavicSlovakSloveneSomaliSouth AfricanSouth AmericanSouth American IndianSoviet UnionSpaniardSpanishSpanish AmericanSpanish American IndianSri LankanSubsaharan AfricanSudaneseSwedishSwissSyrianTaiwaneseThaiTlingit-HaidaTohono O'OdhamTonganTrinidadian and TobagonianTsimshianTurkishU.S. Virgin IslanderUgandanUkrainianUruguayanUteVenezuelanVietnameseWelshWest IndianYakamaYaquiYugoslavianYumanYup'ikZimbabwean
Immigration
NonimmigrantsImmigrantsAfghanistanAfricaAlbaniaArgentinaArmeniaAsiaAustraliaAustriaBahamasBangladeshBarbadosBelarusBelgiumBelizeBoliviaBosnia and HerzegovinaBrazilBulgariaBurma/MyanmarCabo VerdeCambodiaCameroonCanadaCaribbeanCentral AmericaChileChinaColombiaCongoCosta RicaCroatiaCubaCzechoslovakiaDenmarkDominicaDominican RepublicEastern AfricaEastern AsiaEastern EuropeEcuadorEgyptEl SalvadorEnglandEritreaEthiopiaEuropeFijiFranceGermanyGhanaGreeceGrenadaGuatemalaGuyanaHaitiHondurasHong KongHungaryIndiaIndonesiaIranIraqIrelandIsraelItalyJamaicaJapanJordanKazakhstanKenyaKoreaKuwaitLaosLatviaLebanonLiberiaLithuaniaMalaysiaMexicoMicronesiaMiddle AfricaMoldovaMoroccoNepalNetherlandsNicaraguaNigeriaNorth AmericaNorth MacedoniaNorthern AfricaNorthern EuropeNorwayOceaniaPakistanPanamaPeruPhilippinesPolandPortugalRomaniaRussiaSaudi ArabiaScotlandSenegalSerbiaSierra LeoneSingaporeSomaliaSouth AfricaSouth AmericaSouth Central AsiaSouth Eastern AsiaSouthern EuropeSpainSri LankaSt. Vincent and the GrenadinesSudanSwedenSwitzerlandSyriaTaiwanThailandTrinidad and TobagoTurkeyUgandaUkraineUruguayUzbekistanVenezuelaVietnamWest IndiesWestern AfricaWestern AsiaWestern EuropeYemenZaireZimbabweAzores
Currently Married
Income
Poverty
Unemployment
Labor Participation
Family Structure
Vehicle Availability
Education Level
Disability

Currently Married Comparison

Immigrants from Latin America

Natives/Alaskans

Tragic
Tragic
43.8%
CURRENTLY MARRIED
0.1/ 100
METRIC RATING
260th/ 347
METRIC RANK
42.8%
CURRENTLY MARRIED
0.0/ 100
METRIC RATING
288th/ 347
METRIC RANK

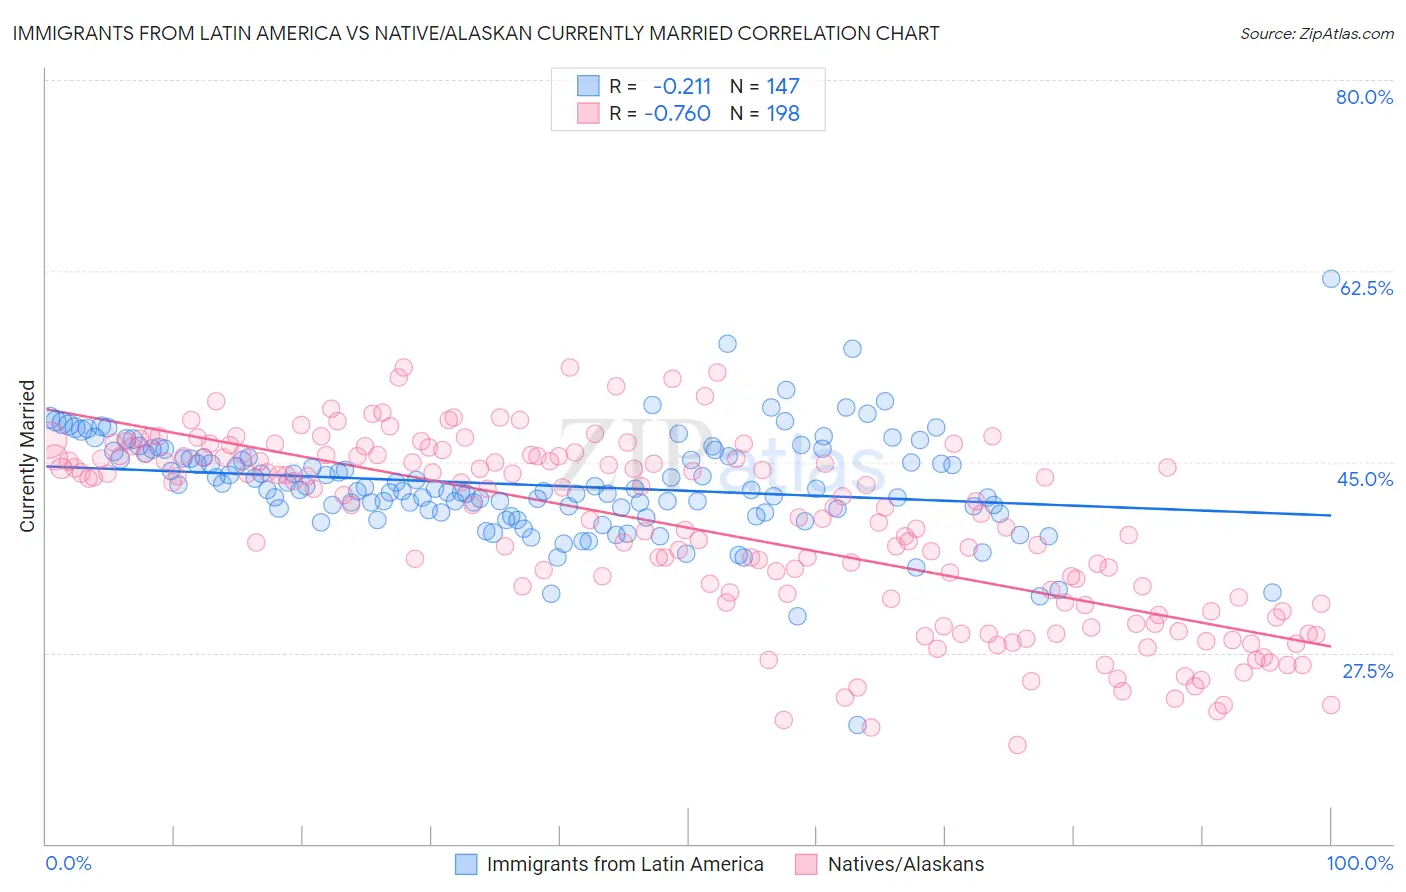
Immigrants from Latin America vs Native/Alaskan Currently Married Correlation Chart

The statistical analysis conducted on geographies consisting of 558,538,971 people shows a weak negative correlation between the proportion of Immigrants from Latin America and percentage of population currently married in the United States with a correlation coefficient (R) of -0.211 and weighted average of 43.8%. Similarly, the statistical analysis conducted on geographies consisting of 512,977,387 people shows a strong negative correlation between the proportion of Natives/Alaskans and percentage of population currently married in the United States with a correlation coefficient (R) of -0.760 and weighted average of 42.8%, a difference of 2.2%.
Immigrants from Latin America vs Native/Alaskan Currently Married

Currently Married Correlation Summary

MeasurementImmigrants from Latin AmericaNative/Alaskan
Minimum20.9%19.1%
Maximum61.8%53.7%
Range40.9%34.6%
Mean42.9%38.9%
Median42.5%41.0%
Interquartile 25% (IQ1)40.6%32.1%
Interquartile 75% (IQ3)45.8%45.5%
Interquartile Range (IQR)5.2%13.5%
Standard Deviation (Sample)4.8%8.3%
Standard Deviation (Population)4.8%8.3%

Similar Demographics by Currently Married

Demographics Similar to Immigrants from Latin America by Currently Married

In terms of currently married, the demographic groups most similar to Immigrants from Latin America are Immigrants from Nicaragua (43.7%, a difference of 0.040%), Immigrants from Sierra Leone (43.8%, a difference of 0.060%), Bangladeshi (43.7%, a difference of 0.18%), Immigrants from Cuba (43.7%, a difference of 0.22%), and Sudanese (43.7%, a difference of 0.24%).
DemographicsRating | RankCurrently Married
Immigrants | Central America
0.3
/100
|
#253
Tragic
44.1%
Vietnamese
0.2
/100
|
#254
Tragic
44.0%
Yakama
0.2
/100
|
#255
Tragic
44.0%
Shoshone
0.2
/100
|
#256
Tragic
44.0%
Immigrants | Africa
0.2
/100
|
#257
Tragic
43.9%
Ute
0.2
/100
|
#258
Tragic
43.9%
Immigrants | Sierra Leone
0.1
/100
|
#259
Tragic
43.8%
Immigrants | Latin America
0.1
/100
|
#260
Tragic
43.8%
Immigrants | Nicaragua
0.1
/100
|
#261
Tragic
43.7%
Bangladeshis
0.1
/100
|
#262
Tragic
43.7%
Immigrants | Cuba
0.1
/100
|
#263
Tragic
43.7%
Sudanese
0.1
/100
|
#264
Tragic
43.7%
Immigrants | Bangladesh
0.1
/100
|
#265
Tragic
43.6%
Ecuadorians
0.1
/100
|
#266
Tragic
43.6%
Immigrants | Eritrea
0.1
/100
|
#267
Tragic
43.6%

Demographics Similar to Natives/Alaskans by Currently Married

In terms of currently married, the demographic groups most similar to Natives/Alaskans are Paiute (42.7%, a difference of 0.23%), Immigrants from Ghana (42.7%, a difference of 0.24%), Guatemalan (42.9%, a difference of 0.27%), Ghanaian (42.9%, a difference of 0.29%), and Immigrants from Guatemala (42.6%, a difference of 0.36%).
DemographicsRating | RankCurrently Married
Chippewa
0.0
/100
|
#281
Tragic
43.2%
Immigrants | Ecuador
0.0
/100
|
#282
Tragic
43.2%
Kiowa
0.0
/100
|
#283
Tragic
43.2%
Immigrants | El Salvador
0.0
/100
|
#284
Tragic
43.1%
Immigrants | Middle Africa
0.0
/100
|
#285
Tragic
43.0%
Ghanaians
0.0
/100
|
#286
Tragic
42.9%
Guatemalans
0.0
/100
|
#287
Tragic
42.9%
Natives/Alaskans
0.0
/100
|
#288
Tragic
42.8%
Paiute
0.0
/100
|
#289
Tragic
42.7%
Immigrants | Ghana
0.0
/100
|
#290
Tragic
42.7%
Immigrants | Guatemala
0.0
/100
|
#291
Tragic
42.6%
Sub-Saharan Africans
0.0
/100
|
#292
Tragic
42.6%
Yuman
0.0
/100
|
#293
Tragic
42.6%
Hondurans
0.0
/100
|
#294
Tragic
42.5%
Immigrants | Western Africa
0.0
/100
|
#295
Tragic
42.4%