Immigrants from Latin America vs Immigrants from Trinidad and Tobago Family Households
COMPARE
Immigrants from Latin America
Immigrants from Trinidad and Tobago
Family Households
Family Households Comparison
Immigrants from Latin America
Immigrants from Trinidad and Tobago
67.2%
FAMILY HOUSEHOLDS
100.0/ 100
METRIC RATING
31st/ 347
METRIC RANK
64.2%
FAMILY HOUSEHOLDS
34.9/ 100
METRIC RATING
181st/ 347
METRIC RANK
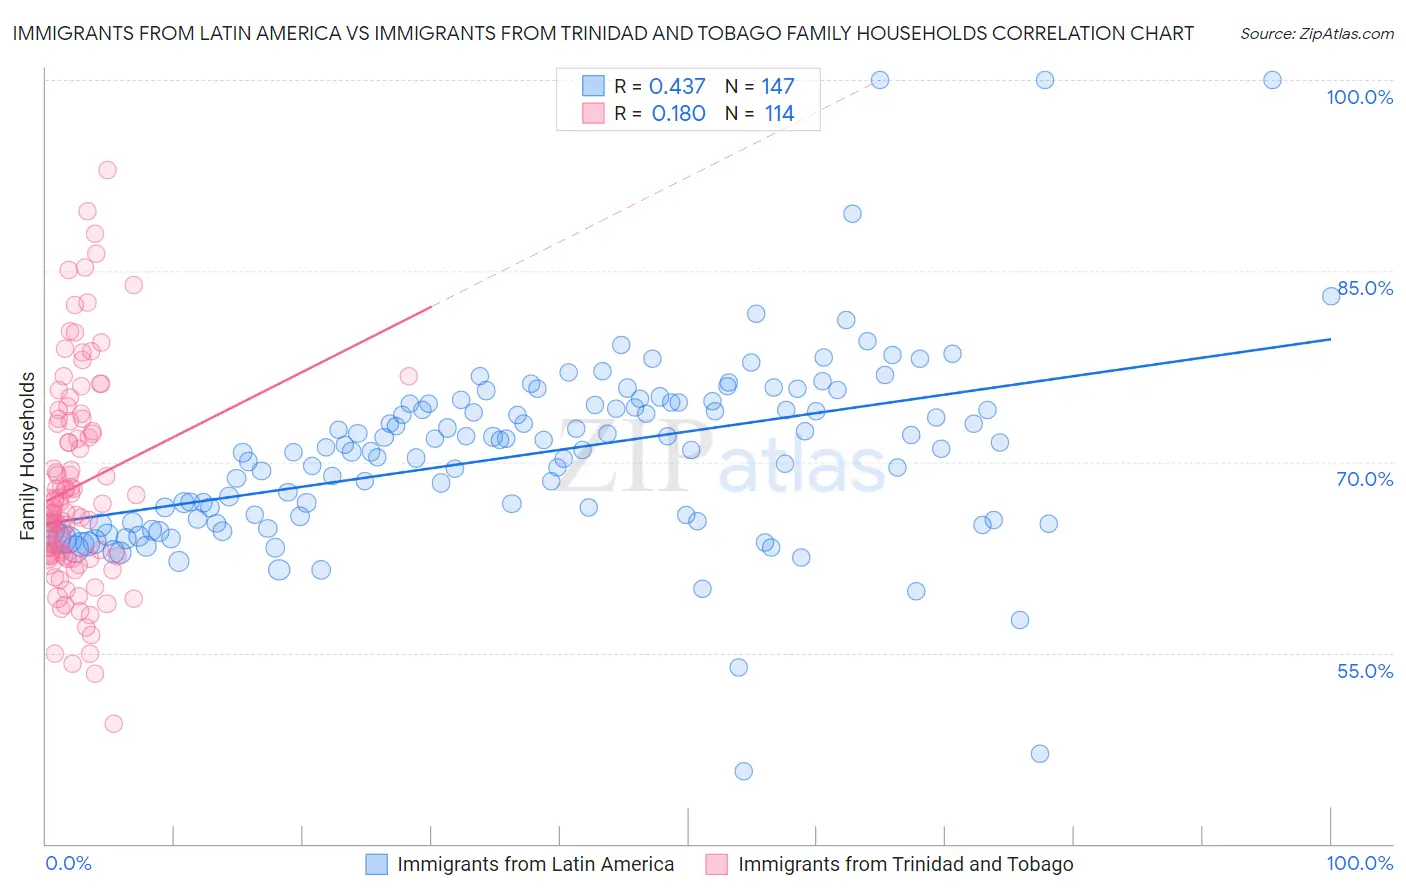
Immigrants from Latin America vs Immigrants from Trinidad and Tobago Family Households Correlation Chart
The statistical analysis conducted on geographies consisting of 558,036,504 people shows a moderate positive correlation between the proportion of Immigrants from Latin America and percentage of family households in the United States with a correlation coefficient (R) of 0.437 and weighted average of 67.2%. Similarly, the statistical analysis conducted on geographies consisting of 223,484,362 people shows a poor positive correlation between the proportion of Immigrants from Trinidad and Tobago and percentage of family households in the United States with a correlation coefficient (R) of 0.180 and weighted average of 64.2%, a difference of 4.8%.
Family Households Correlation Summary
| Measurement | Immigrants from Latin America | Immigrants from Trinidad and Tobago |
| Minimum | 45.7% | 49.5% |
| Maximum | 100.0% | 92.9% |
| Range | 54.3% | 43.4% |
| Mean | 70.6% | 68.1% |
| Median | 70.9% | 66.5% |
| Interquartile 25% (IQ1) | 65.3% | 62.6% |
| Interquartile 75% (IQ3) | 74.5% | 73.2% |
| Interquartile Range (IQR) | 9.3% | 10.5% |
| Standard Deviation (Sample) | 7.5% | 8.3% |
| Standard Deviation (Population) | 7.5% | 8.2% |
Similar Demographics by Family Households
Demographics Similar to Immigrants from Latin America by Family Households
In terms of family households, the demographic groups most similar to Immigrants from Latin America are Immigrants from Peru (67.2%, a difference of 0.010%), Nepalese (67.2%, a difference of 0.060%), Salvadoran (67.2%, a difference of 0.10%), Thai (67.2%, a difference of 0.10%), and Tohono O'odham (67.1%, a difference of 0.15%).
| Demographics | Rating | Rank | Family Households |
| Immigrants | South Eastern Asia | 100.0 /100 | #24 | Exceptional 67.5% |
| Immigrants | Nicaragua | 100.0 /100 | #25 | Exceptional 67.5% |
| Immigrants | India | 100.0 /100 | #26 | Exceptional 67.4% |
| Hispanics or Latinos | 100.0 /100 | #27 | Exceptional 67.4% |
| Hawaiians | 100.0 /100 | #28 | Exceptional 67.4% |
| Nicaraguans | 100.0 /100 | #29 | Exceptional 67.4% |
| Immigrants | Peru | 100.0 /100 | #30 | Exceptional 67.2% |
| Immigrants | Latin America | 100.0 /100 | #31 | Exceptional 67.2% |
| Nepalese | 100.0 /100 | #32 | Exceptional 67.2% |
| Salvadorans | 100.0 /100 | #33 | Exceptional 67.2% |
| Thais | 100.0 /100 | #34 | Exceptional 67.2% |
| Tohono O'odham | 100.0 /100 | #35 | Exceptional 67.1% |
| Peruvians | 100.0 /100 | #36 | Exceptional 67.1% |
| Tsimshian | 100.0 /100 | #37 | Exceptional 67.1% |
| Mexican American Indians | 100.0 /100 | #38 | Exceptional 67.0% |
Demographics Similar to Immigrants from Trinidad and Tobago by Family Households
In terms of family households, the demographic groups most similar to Immigrants from Trinidad and Tobago are Immigrants from Honduras (64.2%, a difference of 0.0%), Ukrainian (64.2%, a difference of 0.0%), Creek (64.2%, a difference of 0.010%), Puerto Rican (64.2%, a difference of 0.020%), and Immigrants from Ukraine (64.2%, a difference of 0.050%).
| Demographics | Rating | Rank | Family Households |
| Immigrants | Germany | 50.0 /100 | #174 | Average 64.3% |
| Bangladeshis | 44.3 /100 | #175 | Average 64.3% |
| Vietnamese | 43.6 /100 | #176 | Average 64.2% |
| Immigrants | Micronesia | 42.3 /100 | #177 | Average 64.2% |
| Jamaicans | 40.6 /100 | #178 | Average 64.2% |
| Immigrants | Ukraine | 38.2 /100 | #179 | Fair 64.2% |
| Immigrants | Honduras | 35.0 /100 | #180 | Fair 64.2% |
| Immigrants | Trinidad and Tobago | 34.9 /100 | #181 | Fair 64.2% |
| Ukrainians | 34.6 /100 | #182 | Fair 64.2% |
| Creek | 34.1 /100 | #183 | Fair 64.2% |
| Puerto Ricans | 33.4 /100 | #184 | Fair 64.2% |
| Immigrants | Iran | 30.4 /100 | #185 | Fair 64.1% |
| Spanish Americans | 30.1 /100 | #186 | Fair 64.1% |
| Northern Europeans | 28.2 /100 | #187 | Fair 64.1% |
| Paraguayans | 26.7 /100 | #188 | Fair 64.1% |