Immigrants from Laos vs Ute Average Family Size
COMPARE
Immigrants from Laos
Ute
Average Family Size
Average Family Size Comparison
Immigrants from Laos
Ute
3.34
AVERAGE FAMILY SIZE
99.9/ 100
METRIC RATING
65th/ 347
METRIC RANK
3.49
AVERAGE FAMILY SIZE
100.0/ 100
METRIC RATING
16th/ 347
METRIC RANK
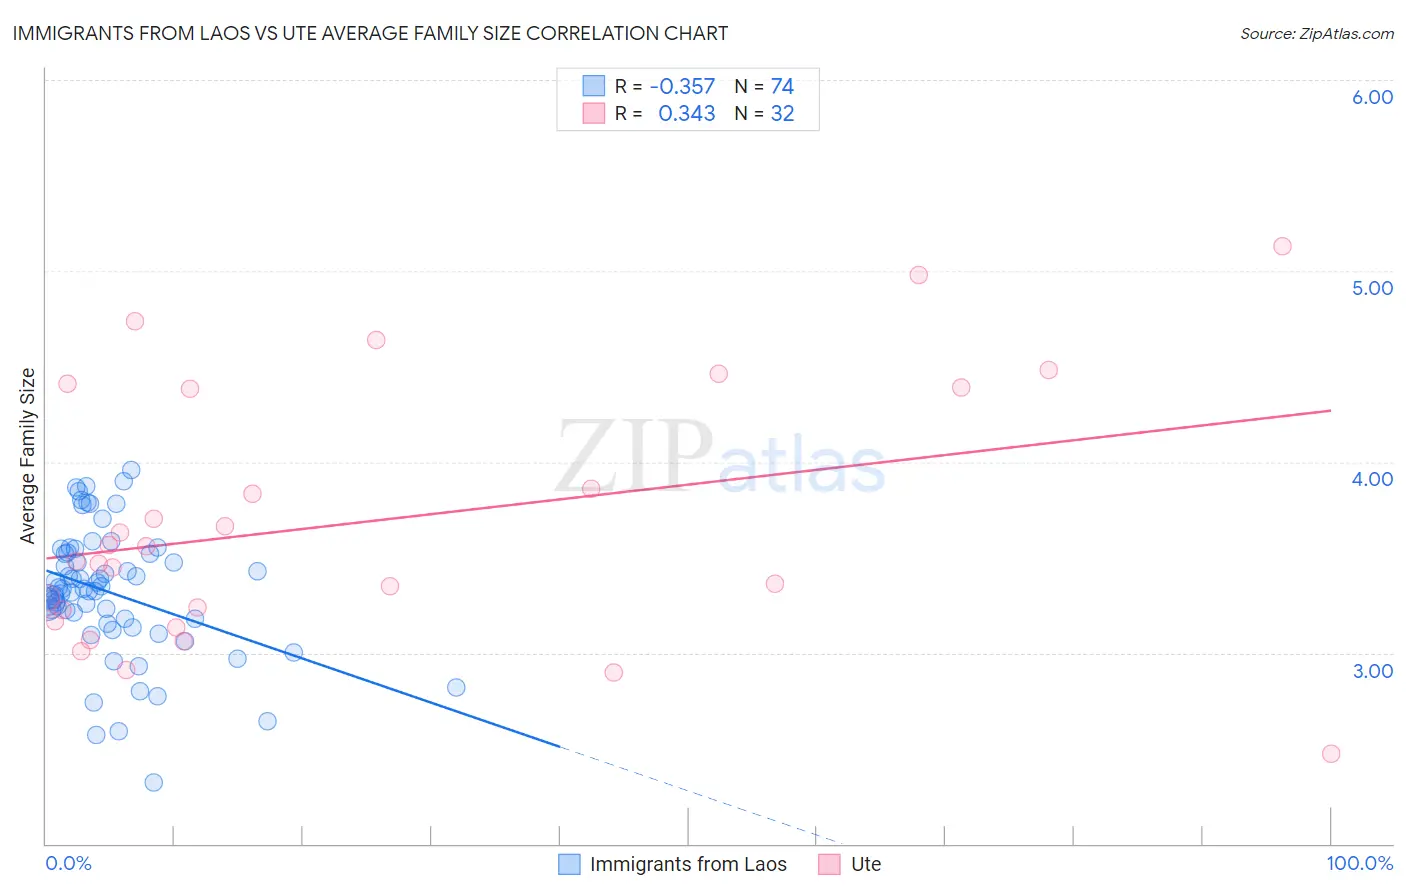
Immigrants from Laos vs Ute Average Family Size Correlation Chart
The statistical analysis conducted on geographies consisting of 201,468,648 people shows a mild negative correlation between the proportion of Immigrants from Laos and average family size in the United States with a correlation coefficient (R) of -0.357 and weighted average of 3.34. Similarly, the statistical analysis conducted on geographies consisting of 55,658,636 people shows a mild positive correlation between the proportion of Ute and average family size in the United States with a correlation coefficient (R) of 0.343 and weighted average of 3.49, a difference of 4.6%.
Average Family Size Correlation Summary
| Measurement | Immigrants from Laos | Ute |
| Minimum | 2.32 | 2.47 |
| Maximum | 3.96 | 5.13 |
| Range | 1.64 | 2.66 |
| Mean | 3.32 | 3.69 |
| Median | 3.33 | 3.52 |
| Interquartile 25% (IQ1) | 3.18 | 3.19 |
| Interquartile 75% (IQ3) | 3.52 | 4.38 |
| Interquartile Range (IQR) | 0.34 | 1.19 |
| Standard Deviation (Sample) | 0.33 | 0.67 |
| Standard Deviation (Population) | 0.33 | 0.66 |
Similar Demographics by Average Family Size
Demographics Similar to Immigrants from Laos by Average Family Size
In terms of average family size, the demographic groups most similar to Immigrants from Laos are Dominican (3.34, a difference of 0.020%), Immigrants from St. Vincent and the Grenadines (3.34, a difference of 0.060%), Chinese (3.34, a difference of 0.090%), Immigrants from Jamaica (3.33, a difference of 0.10%), and Immigrants from Grenada (3.34, a difference of 0.11%).
| Demographics | Rating | Rank | Average Family Size |
| Hondurans | 100.0 /100 | #58 | Exceptional 3.35 |
| Japanese | 100.0 /100 | #59 | Exceptional 3.35 |
| Immigrants | Armenia | 100.0 /100 | #60 | Exceptional 3.35 |
| Central American Indians | 100.0 /100 | #61 | Exceptional 3.35 |
| Immigrants | Grenada | 100.0 /100 | #62 | Exceptional 3.34 |
| Chinese | 100.0 /100 | #63 | Exceptional 3.34 |
| Dominicans | 99.9 /100 | #64 | Exceptional 3.34 |
| Immigrants | Laos | 99.9 /100 | #65 | Exceptional 3.34 |
| Immigrants | St. Vincent and the Grenadines | 99.9 /100 | #66 | Exceptional 3.34 |
| Immigrants | Jamaica | 99.9 /100 | #67 | Exceptional 3.33 |
| Immigrants | Cambodia | 99.9 /100 | #68 | Exceptional 3.33 |
| Immigrants | Immigrants | 99.9 /100 | #69 | Exceptional 3.33 |
| Immigrants | Trinidad and Tobago | 99.9 /100 | #70 | Exceptional 3.33 |
| Immigrants | West Indies | 99.9 /100 | #71 | Exceptional 3.33 |
| Immigrants | Caribbean | 99.9 /100 | #72 | Exceptional 3.33 |
Demographics Similar to Ute by Average Family Size
In terms of average family size, the demographic groups most similar to Ute are Tongan (3.49, a difference of 0.060%), Immigrants from El Salvador (3.49, a difference of 0.090%), Immigrants from Central America (3.49, a difference of 0.11%), Salvadoran (3.48, a difference of 0.34%), and Mexican (3.48, a difference of 0.40%).
| Demographics | Rating | Rank | Average Family Size |
| Hopi | 100.0 /100 | #9 | Exceptional 3.60 |
| Spanish American Indians | 100.0 /100 | #10 | Exceptional 3.58 |
| Tohono O'odham | 100.0 /100 | #11 | Exceptional 3.53 |
| Immigrants | Mexico | 100.0 /100 | #12 | Exceptional 3.52 |
| Sioux | 100.0 /100 | #13 | Exceptional 3.52 |
| Immigrants | Central America | 100.0 /100 | #14 | Exceptional 3.49 |
| Tongans | 100.0 /100 | #15 | Exceptional 3.49 |
| Ute | 100.0 /100 | #16 | Exceptional 3.49 |
| Immigrants | El Salvador | 100.0 /100 | #17 | Exceptional 3.49 |
| Salvadorans | 100.0 /100 | #18 | Exceptional 3.48 |
| Mexicans | 100.0 /100 | #19 | Exceptional 3.48 |
| Cheyenne | 100.0 /100 | #20 | Exceptional 3.47 |
| Yuman | 100.0 /100 | #21 | Exceptional 3.47 |
| Apache | 100.0 /100 | #22 | Exceptional 3.46 |
| Immigrants | Fiji | 100.0 /100 | #23 | Exceptional 3.45 |