Immigrants from Kuwait vs Immigrants from Eastern Asia Family Households with Children
COMPARE
Immigrants from Kuwait
Immigrants from Eastern Asia
Family Households with Children
Family Households with Children Comparison
Immigrants from Kuwait
Immigrants from Eastern Asia
27.5%
FAMILY HOUSEHOLDS WITH CHILDREN
60.9/ 100
METRIC RATING
168th/ 347
METRIC RANK
27.7%
FAMILY HOUSEHOLDS WITH CHILDREN
81.7/ 100
METRIC RATING
141st/ 347
METRIC RANK
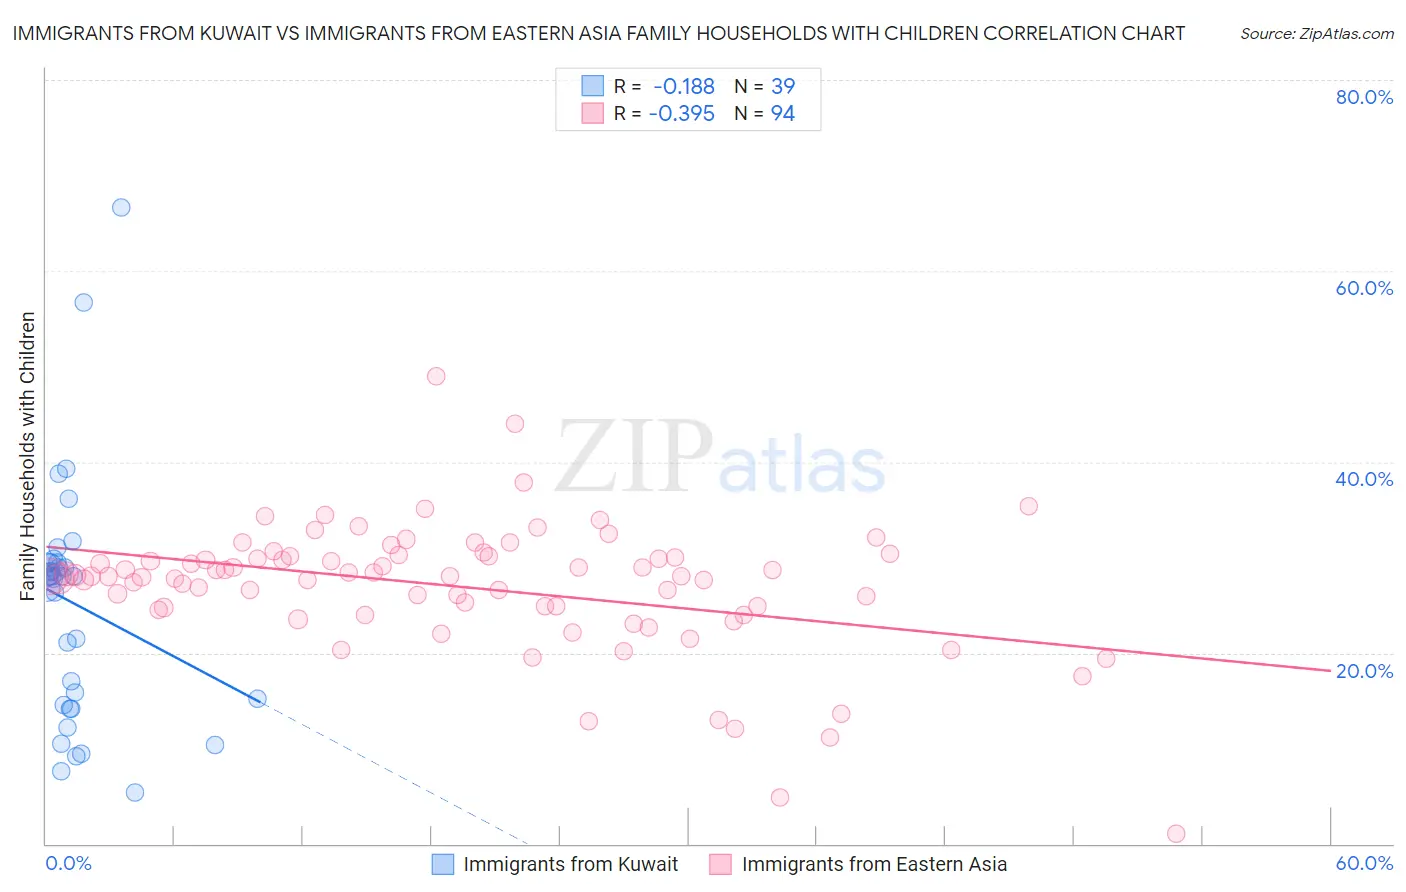
Immigrants from Kuwait vs Immigrants from Eastern Asia Family Households with Children Correlation Chart
The statistical analysis conducted on geographies consisting of 136,880,094 people shows a poor negative correlation between the proportion of Immigrants from Kuwait and percentage of family households with children in the United States with a correlation coefficient (R) of -0.188 and weighted average of 27.5%. Similarly, the statistical analysis conducted on geographies consisting of 499,144,786 people shows a mild negative correlation between the proportion of Immigrants from Eastern Asia and percentage of family households with children in the United States with a correlation coefficient (R) of -0.395 and weighted average of 27.7%, a difference of 0.58%.
Family Households with Children Correlation Summary
| Measurement | Immigrants from Kuwait | Immigrants from Eastern Asia |
| Minimum | 5.3% | 1.0% |
| Maximum | 66.6% | 49.0% |
| Range | 61.3% | 48.0% |
| Mean | 25.1% | 26.9% |
| Median | 28.0% | 28.0% |
| Interquartile 25% (IQ1) | 14.5% | 24.7% |
| Interquartile 75% (IQ3) | 29.4% | 30.1% |
| Interquartile Range (IQR) | 14.9% | 5.4% |
| Standard Deviation (Sample) | 12.5% | 6.9% |
| Standard Deviation (Population) | 12.3% | 6.8% |
Similar Demographics by Family Households with Children
Demographics Similar to Immigrants from Kuwait by Family Households with Children
In terms of family households with children, the demographic groups most similar to Immigrants from Kuwait are Immigrants from South Africa (27.5%, a difference of 0.010%), Nonimmigrants (27.5%, a difference of 0.010%), Dominican (27.5%, a difference of 0.010%), Immigrants from Hong Kong (27.5%, a difference of 0.090%), and Seminole (27.5%, a difference of 0.090%).
| Demographics | Rating | Rank | Family Households with Children |
| Alaskan Athabascans | 67.1 /100 | #161 | Good 27.6% |
| Immigrants | Bangladesh | 67.0 /100 | #162 | Good 27.6% |
| Czechs | 65.3 /100 | #163 | Good 27.5% |
| Immigrants | Hong Kong | 64.9 /100 | #164 | Good 27.5% |
| Immigrants | South Africa | 61.3 /100 | #165 | Good 27.5% |
| Immigrants | Nonimmigrants | 61.2 /100 | #166 | Good 27.5% |
| Dominicans | 61.1 /100 | #167 | Good 27.5% |
| Immigrants | Kuwait | 60.9 /100 | #168 | Good 27.5% |
| Seminole | 56.9 /100 | #169 | Average 27.5% |
| Cherokee | 56.7 /100 | #170 | Average 27.5% |
| Blackfeet | 54.3 /100 | #171 | Average 27.5% |
| Israelis | 53.9 /100 | #172 | Average 27.5% |
| Immigrants | Argentina | 52.2 /100 | #173 | Average 27.5% |
| Whites/Caucasians | 50.0 /100 | #174 | Average 27.4% |
| British | 49.9 /100 | #175 | Average 27.4% |
Demographics Similar to Immigrants from Eastern Asia by Family Households with Children
In terms of family households with children, the demographic groups most similar to Immigrants from Eastern Asia are Spanish (27.7%, a difference of 0.0%), Swiss (27.7%, a difference of 0.010%), Vietnamese (27.7%, a difference of 0.030%), Immigrants from Eastern Africa (27.7%, a difference of 0.050%), and Uruguayan (27.7%, a difference of 0.060%).
| Demographics | Rating | Rank | Family Households with Children |
| Immigrants | Panama | 84.9 /100 | #134 | Excellent 27.7% |
| Immigrants | Ecuador | 84.6 /100 | #135 | Excellent 27.7% |
| Immigrants | Portugal | 84.1 /100 | #136 | Excellent 27.7% |
| Immigrants | Dominican Republic | 83.9 /100 | #137 | Excellent 27.7% |
| Uruguayans | 83.2 /100 | #138 | Excellent 27.7% |
| Vietnamese | 82.6 /100 | #139 | Excellent 27.7% |
| Spanish | 81.8 /100 | #140 | Excellent 27.7% |
| Immigrants | Eastern Asia | 81.7 /100 | #141 | Excellent 27.7% |
| Swiss | 81.4 /100 | #142 | Excellent 27.7% |
| Immigrants | Eastern Africa | 80.2 /100 | #143 | Excellent 27.7% |
| Brazilians | 79.6 /100 | #144 | Good 27.7% |
| Immigrants | Chile | 79.5 /100 | #145 | Good 27.7% |
| Basques | 79.5 /100 | #146 | Good 27.7% |
| Immigrants | Moldova | 79.1 /100 | #147 | Good 27.6% |
| Osage | 79.0 /100 | #148 | Good 27.6% |