Immigrants from Kuwait vs Colombian Currently Married
COMPARE
Immigrants from Kuwait
Colombian
Currently Married
Currently Married Comparison
Immigrants from Kuwait
Colombians
46.1%
CURRENTLY MARRIED
21.7/ 100
METRIC RATING
197th/ 347
METRIC RANK
46.3%
CURRENTLY MARRIED
31.8/ 100
METRIC RATING
188th/ 347
METRIC RANK
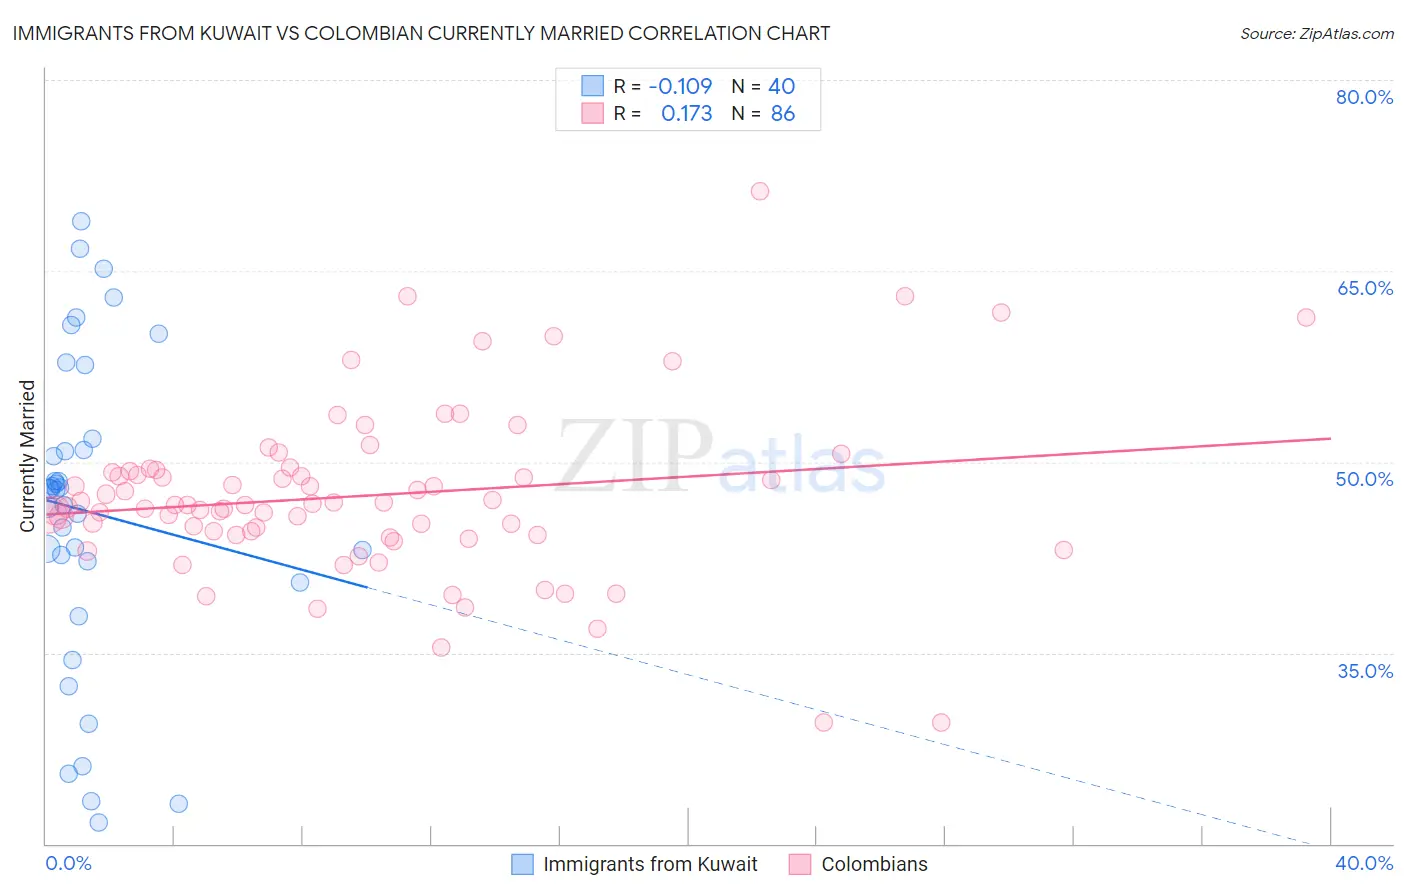
Immigrants from Kuwait vs Colombian Currently Married Correlation Chart
The statistical analysis conducted on geographies consisting of 136,899,142 people shows a poor negative correlation between the proportion of Immigrants from Kuwait and percentage of population currently married in the United States with a correlation coefficient (R) of -0.109 and weighted average of 46.1%. Similarly, the statistical analysis conducted on geographies consisting of 419,624,806 people shows a poor positive correlation between the proportion of Colombians and percentage of population currently married in the United States with a correlation coefficient (R) of 0.173 and weighted average of 46.3%, a difference of 0.48%.
Currently Married Correlation Summary
| Measurement | Immigrants from Kuwait | Colombian |
| Minimum | 21.7% | 29.5% |
| Maximum | 68.9% | 71.3% |
| Range | 47.2% | 41.8% |
| Mean | 46.1% | 47.4% |
| Median | 47.8% | 46.6% |
| Interquartile 25% (IQ1) | 41.4% | 44.3% |
| Interquartile 75% (IQ3) | 51.4% | 49.3% |
| Interquartile Range (IQR) | 10.0% | 5.0% |
| Standard Deviation (Sample) | 12.3% | 6.8% |
| Standard Deviation (Population) | 12.1% | 6.7% |
Demographics Similar to Immigrants from Kuwait and Colombians by Currently Married
In terms of currently married, the demographic groups most similar to Immigrants from Kuwait are Immigrants from Bosnia and Herzegovina (46.1%, a difference of 0.030%), Immigrants from Colombia (46.1%, a difference of 0.040%), Immigrants from Nepal (46.1%, a difference of 0.10%), South American (46.1%, a difference of 0.11%), and Immigrants from Costa Rica (46.0%, a difference of 0.12%). Similarly, the demographic groups most similar to Colombians are Fijian (46.3%, a difference of 0.060%), Choctaw (46.3%, a difference of 0.12%), Immigrants from Peru (46.4%, a difference of 0.14%), Immigrants from France (46.2%, a difference of 0.18%), and Immigrants from Chile (46.4%, a difference of 0.20%).
| Demographics | Rating | Rank | Currently Married |
| Potawatomi | 41.9 /100 | #182 | Average 46.5% |
| Immigrants | Northern Africa | 39.7 /100 | #183 | Fair 46.5% |
| Brazilians | 39.3 /100 | #184 | Fair 46.4% |
| Mongolians | 37.6 /100 | #185 | Fair 46.4% |
| Immigrants | Chile | 36.8 /100 | #186 | Fair 46.4% |
| Immigrants | Peru | 35.3 /100 | #187 | Fair 46.4% |
| Colombians | 31.8 /100 | #188 | Fair 46.3% |
| Fijians | 30.3 /100 | #189 | Fair 46.3% |
| Choctaw | 29.1 /100 | #190 | Fair 46.3% |
| Immigrants | France | 27.7 /100 | #191 | Fair 46.2% |
| Soviet Union | 25.7 /100 | #192 | Fair 46.2% |
| Immigrants | Fiji | 25.0 /100 | #193 | Fair 46.2% |
| South Americans | 23.8 /100 | #194 | Fair 46.1% |
| Immigrants | Nepal | 23.7 /100 | #195 | Fair 46.1% |
| Immigrants | Bosnia and Herzegovina | 22.2 /100 | #196 | Fair 46.1% |
| Immigrants | Kuwait | 21.7 /100 | #197 | Fair 46.1% |
| Immigrants | Colombia | 21.0 /100 | #198 | Fair 46.1% |
| Immigrants | Costa Rica | 19.6 /100 | #199 | Poor 46.0% |
| Creek | 17.2 /100 | #200 | Poor 46.0% |
| Malaysians | 15.3 /100 | #201 | Poor 45.9% |
| Immigrants | Albania | 14.5 /100 | #202 | Poor 45.9% |