Immigrants from Kazakhstan vs Zimbabwean Married-couple Households

COMPARE

Immigrants from Kazakhstan
Race
Ancestry
AfghanAfricanAlaska NativeAlaskan AthabascanAlbanianAleutAlsatianAmericanApacheArabArapahoArgentineanArmenianAssyrian/Chaldean/SyriacAustralianAustrianBahamianBangladeshiBarbadianBasqueBelgianBelizeanBermudanBhutaneseBlackfeetBolivianBrazilianBritishBritish West IndianBulgarianBurmeseCajunCambodianCanadianCape VerdeanCarpatho RusynCelticCentral AmericanCentral American IndianCherokeeCheyenneChickasawChileanChineseChippewaChoctawColombianColvilleComancheCosta RicanCreeCreekCroatianCrowCubanCypriotCzechCzechoslovakianDanishDelawareDominicanDutchDutch West IndianEastern EuropeanEcuadorianEgyptianEnglishEstonianEthiopianEuropeanFijianFilipinoFinnishFrenchFrench American IndianFrench CanadianGermanGerman RussianGhanaianGreekGuamanian/ChamorroGuatemalanGuyaneseHaitianHmongHonduranHopiHoumaHungarianIcelanderIndian (Asian)IndonesianInupiatIranianIraqiIrishIroquoisIsraeliItalianJamaicanJapaneseJordanianKenyanKiowaKoreanLaotianLatvianLebaneseLiberianLithuanianLumbeeLuxembourgerMacedonianMalaysianMalteseMarshalleseMenomineeMexicanMexican American IndianMongolianMoroccanNative HawaiianNavajoNepaleseNew ZealanderNicaraguanNigerianNorthern EuropeanNorwegianOkinawanOsageOttawaPaiutePakistaniPalestinianPanamanianParaguayanPennsylvania GermanPeruvianPimaPolishPortuguesePotawatomiPuebloPuerto RicanPuget Sound SalishRomanianRussianSalvadoranSamoanScandinavianScotch-IrishScottishSeminoleSenegaleseSerbianShoshoneSierra LeoneanSiouxSlavicSlovakSloveneSomaliSouth AfricanSouth AmericanSouth American IndianSoviet UnionSpaniardSpanishSpanish AmericanSpanish American IndianSri LankanSubsaharan AfricanSudaneseSwedishSwissSyrianTaiwaneseThaiTlingit-HaidaTohono O'OdhamTonganTrinidadian and TobagonianTsimshianTurkishU.S. Virgin IslanderUgandanUkrainianUruguayanUteVenezuelanVietnameseWelshWest IndianYakamaYaquiYugoslavianYumanYup'ik
Immigration
NonimmigrantsImmigrantsAfghanistanAfricaAlbaniaArgentinaArmeniaAsiaAustraliaAustriaBahamasBangladeshBarbadosBelarusBelgiumBelizeBoliviaBosnia and HerzegovinaBrazilBulgariaBurma/MyanmarCabo VerdeCambodiaCameroonCanadaCaribbeanCentral AmericaChileChinaColombiaCongoCosta RicaCroatiaCubaCzechoslovakiaDenmarkDominicaDominican RepublicEastern AfricaEastern AsiaEastern EuropeEcuadorEgyptEl SalvadorEnglandEritreaEthiopiaEuropeFijiFranceGermanyGhanaGreeceGrenadaGuatemalaGuyanaHaitiHondurasHong KongHungaryIndiaIndonesiaIranIraqIrelandIsraelItalyJamaicaJapanJordanKazakhstanKenyaKoreaKuwaitLaosLatin AmericaLatviaLebanonLiberiaLithuaniaMalaysiaMexicoMicronesiaMiddle AfricaMoldovaMoroccoNepalNetherlandsNicaraguaNigeriaNorth AmericaNorth MacedoniaNorthern AfricaNorthern EuropeNorwayOceaniaPakistanPanamaPeruPhilippinesPolandPortugalRomaniaRussiaSaudi ArabiaScotlandSenegalSerbiaSierra LeoneSingaporeSomaliaSouth AfricaSouth AmericaSouth Central AsiaSouth Eastern AsiaSouthern EuropeSpainSri LankaSt. Vincent and the GrenadinesSudanSwedenSwitzerlandSyriaTaiwanThailandTrinidad and TobagoTurkeyUgandaUkraineUruguayUzbekistanVenezuelaVietnamWest IndiesWestern AfricaWestern AsiaWestern EuropeYemenZaireZimbabweAzores
Zimbabwean
Race
Ancestry
AfghanAfricanAlaska NativeAlaskan AthabascanAlbanianAleutAlsatianAmericanApacheArabArapahoArgentineanArmenianAssyrian/Chaldean/SyriacAustralianAustrianBahamianBangladeshiBarbadianBasqueBelgianBelizeanBermudanBhutaneseBlackfeetBolivianBrazilianBritishBritish West IndianBulgarianBurmeseCajunCambodianCanadianCape VerdeanCarpatho RusynCelticCentral AmericanCentral American IndianCherokeeCheyenneChickasawChileanChineseChippewaChoctawColombianColvilleComancheCosta RicanCreeCreekCroatianCrowCubanCypriotCzechCzechoslovakianDanishDelawareDominicanDutchDutch West IndianEastern EuropeanEcuadorianEgyptianEnglishEstonianEthiopianEuropeanFijianFilipinoFinnishFrenchFrench American IndianFrench CanadianGermanGerman RussianGhanaianGreekGuamanian/ChamorroGuatemalanGuyaneseHaitianHmongHonduranHopiHoumaHungarianIcelanderIndian (Asian)IndonesianInupiatIranianIraqiIrishIroquoisIsraeliItalianJamaicanJapaneseJordanianKenyanKiowaKoreanLaotianLatvianLebaneseLiberianLithuanianLumbeeLuxembourgerMacedonianMalaysianMalteseMarshalleseMenomineeMexicanMexican American IndianMongolianMoroccanNative HawaiianNavajoNepaleseNew ZealanderNicaraguanNigerianNorthern EuropeanNorwegianOkinawanOsageOttawaPaiutePakistaniPalestinianPanamanianParaguayanPennsylvania GermanPeruvianPimaPolishPortuguesePotawatomiPuebloPuerto RicanPuget Sound SalishRomanianRussianSalvadoranSamoanScandinavianScotch-IrishScottishSeminoleSenegaleseSerbianShoshoneSierra LeoneanSiouxSlavicSlovakSloveneSomaliSouth AfricanSouth AmericanSouth American IndianSoviet UnionSpaniardSpanishSpanish AmericanSpanish American IndianSri LankanSubsaharan AfricanSudaneseSwedishSwissSyrianTaiwaneseThaiTlingit-HaidaTohono O'OdhamTonganTrinidadian and TobagonianTsimshianTurkishU.S. Virgin IslanderUgandanUkrainianUruguayanUteVenezuelanVietnameseWelshWest IndianYakamaYaquiYugoslavianYumanYup'ikZimbabwean
Immigration
NonimmigrantsImmigrantsAfghanistanAfricaAlbaniaArgentinaArmeniaAsiaAustraliaAustriaBahamasBangladeshBarbadosBelarusBelgiumBelizeBoliviaBosnia and HerzegovinaBrazilBulgariaBurma/MyanmarCabo VerdeCambodiaCameroonCanadaCaribbeanCentral AmericaChileChinaColombiaCongoCosta RicaCroatiaCubaCzechoslovakiaDenmarkDominicaDominican RepublicEastern AfricaEastern AsiaEastern EuropeEcuadorEgyptEl SalvadorEnglandEritreaEthiopiaEuropeFijiFranceGermanyGhanaGreeceGrenadaGuatemalaGuyanaHaitiHondurasHong KongHungaryIndiaIndonesiaIranIraqIrelandIsraelItalyJamaicaJapanJordanKenyaKoreaKuwaitLaosLatin AmericaLatviaLebanonLiberiaLithuaniaMalaysiaMexicoMicronesiaMiddle AfricaMoldovaMoroccoNepalNetherlandsNicaraguaNigeriaNorth AmericaNorth MacedoniaNorthern AfricaNorthern EuropeNorwayOceaniaPakistanPanamaPeruPhilippinesPolandPortugalRomaniaRussiaSaudi ArabiaScotlandSenegalSerbiaSierra LeoneSingaporeSomaliaSouth AfricaSouth AmericaSouth Central AsiaSouth Eastern AsiaSouthern EuropeSpainSri LankaSt. Vincent and the GrenadinesSudanSwedenSwitzerlandSyriaTaiwanThailandTrinidad and TobagoTurkeyUgandaUkraineUruguayUzbekistanVenezuelaVietnamWest IndiesWestern AfricaWestern AsiaWestern EuropeYemenZaireZimbabweAzores
Married-couple Households
Income
Poverty
Unemployment
Labor Participation
Family Structure
Vehicle Availability
Education Level
Disability

Married-couple Households Comparison

Immigrants from Kazakhstan

Zimbabweans

Good
Excellent
46.8%
MARRIED-COUPLE HOUSEHOLDS
70.0/ 100
METRIC RATING
164th/ 347
METRIC RANK
47.4%
MARRIED-COUPLE HOUSEHOLDS
89.2/ 100
METRIC RATING
124th/ 347
METRIC RANK

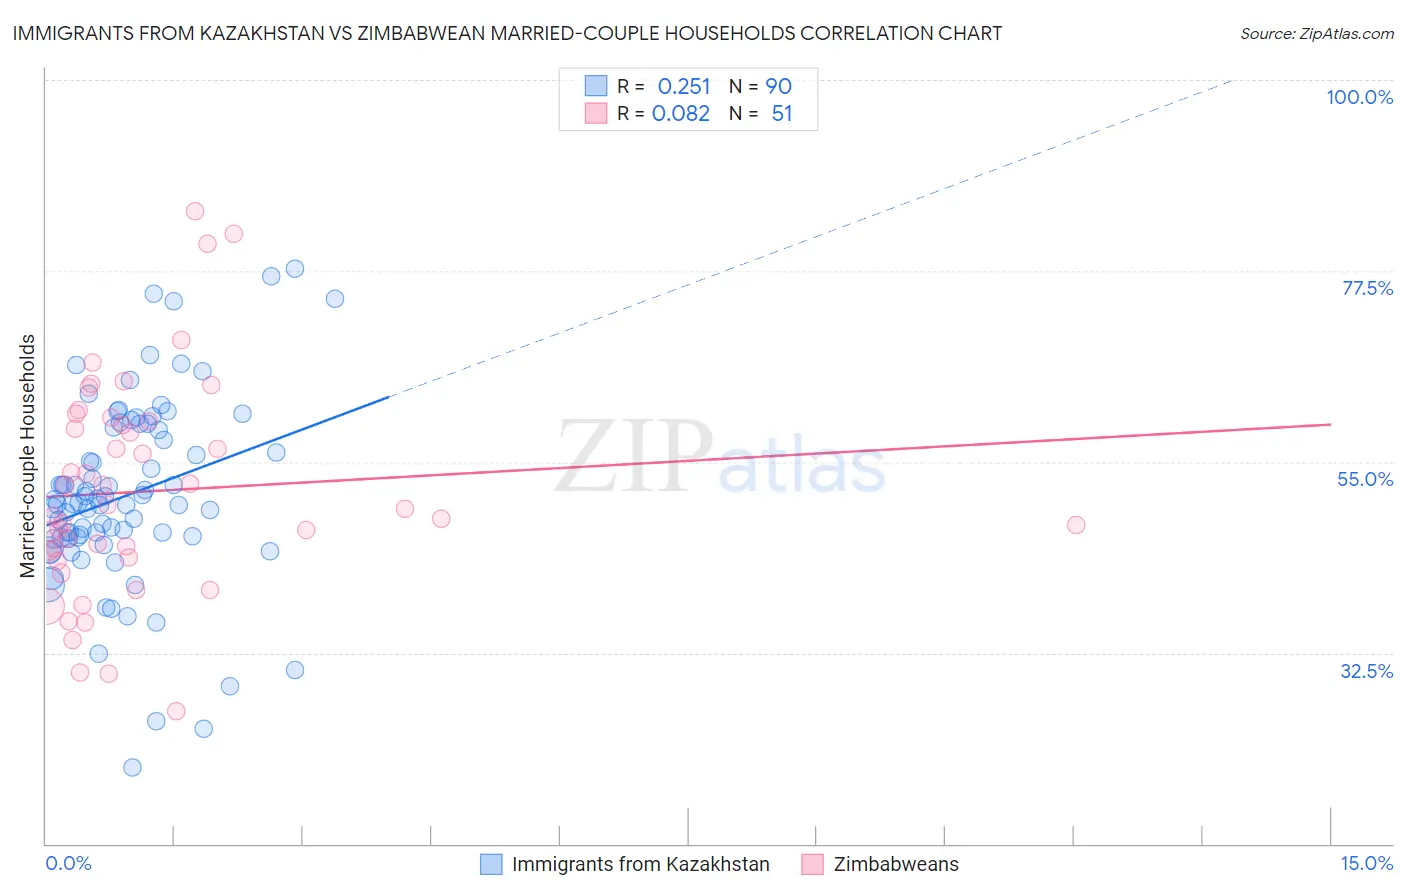
Immigrants from Kazakhstan vs Zimbabwean Married-couple Households Correlation Chart

The statistical analysis conducted on geographies consisting of 124,426,668 people shows a weak positive correlation between the proportion of Immigrants from Kazakhstan and percentage of married-couple family households in the United States with a correlation coefficient (R) of 0.251 and weighted average of 46.8%. Similarly, the statistical analysis conducted on geographies consisting of 69,192,017 people shows a slight positive correlation between the proportion of Zimbabweans and percentage of married-couple family households in the United States with a correlation coefficient (R) of 0.082 and weighted average of 47.4%, a difference of 1.2%.
Immigrants from Kazakhstan vs Zimbabwean Married-couple Households

Married-couple Households Correlation Summary

MeasurementImmigrants from KazakhstanZimbabwean
Minimum19.0%25.7%
Maximum77.7%84.6%
Range58.8%58.9%
Mean51.1%51.5%
Median50.2%49.5%
Interquartile 25% (IQ1)46.0%43.8%
Interquartile 75% (IQ3)59.1%59.8%
Interquartile Range (IQR)13.0%16.0%
Standard Deviation (Sample)11.1%12.8%
Standard Deviation (Population)11.1%12.6%

Similar Demographics by Married-couple Households

Demographics Similar to Immigrants from Kazakhstan by Married-couple Households

In terms of married-couple households, the demographic groups most similar to Immigrants from Kazakhstan are Immigrants from Southern Europe (46.8%, a difference of 0.0%), Immigrants from Turkey (46.8%, a difference of 0.010%), Colombian (46.8%, a difference of 0.050%), Delaware (46.8%, a difference of 0.060%), and Iraqi (46.9%, a difference of 0.080%).
DemographicsRating | RankMarried-couple Households
Immigrants | Oceania
74.8
/100
|
#157
Good
46.9%
Immigrants | Nonimmigrants
73.3
/100
|
#158
Good
46.9%
Osage
73.2
/100
|
#159
Good
46.9%
Iraqis
71.7
/100
|
#160
Good
46.9%
Delaware
71.2
/100
|
#161
Good
46.8%
Colombians
71.0
/100
|
#162
Good
46.8%
Immigrants | Turkey
70.2
/100
|
#163
Good
46.8%
Immigrants | Kazakhstan
70.0
/100
|
#164
Good
46.8%
Immigrants | Southern Europe
69.9
/100
|
#165
Good
46.8%
Cherokee
65.7
/100
|
#166
Good
46.7%
Immigrants | Croatia
64.2
/100
|
#167
Good
46.7%
Israelis
62.3
/100
|
#168
Good
46.7%
Spanish American Indians
59.4
/100
|
#169
Average
46.6%
South Americans
58.0
/100
|
#170
Average
46.6%
Immigrants | Chile
55.7
/100
|
#171
Average
46.5%

Demographics Similar to Zimbabweans by Married-couple Households

In terms of married-couple households, the demographic groups most similar to Zimbabweans are Immigrants from Venezuela (47.4%, a difference of 0.010%), Australian (47.4%, a difference of 0.020%), Pakistani (47.3%, a difference of 0.050%), Okinawan (47.4%, a difference of 0.090%), and Celtic (47.3%, a difference of 0.10%).
DemographicsRating | RankMarried-couple Households
French Canadians
92.4
/100
|
#117
Exceptional
47.5%
Immigrants | Germany
92.4
/100
|
#118
Exceptional
47.5%
Chileans
92.2
/100
|
#119
Exceptional
47.5%
Puget Sound Salish
90.5
/100
|
#120
Exceptional
47.4%
Immigrants | Eastern Europe
90.3
/100
|
#121
Exceptional
47.4%
Okinawans
90.1
/100
|
#122
Exceptional
47.4%
Immigrants | Venezuela
89.3
/100
|
#123
Excellent
47.4%
Zimbabweans
89.2
/100
|
#124
Excellent
47.4%
Australians
89.0
/100
|
#125
Excellent
47.4%
Pakistanis
88.6
/100
|
#126
Excellent
47.3%
Celtics
88.1
/100
|
#127
Excellent
47.3%
Immigrants | Peru
87.9
/100
|
#128
Excellent
47.3%
Immigrants | Iraq
87.8
/100
|
#129
Excellent
47.3%
Immigrants | Hungary
87.8
/100
|
#130
Excellent
47.3%
Immigrants | Denmark
87.5
/100
|
#131
Excellent
47.3%