Immigrants from Kazakhstan vs Immigrants from South Africa Births to Unmarried Women
COMPARE
Immigrants from Kazakhstan
Immigrants from South Africa
Births to Unmarried Women
Births to Unmarried Women Comparison
Immigrants from Kazakhstan
Immigrants from South Africa
28.1%
BIRTHS TO UNMARRIED WOMEN
99.1/ 100
METRIC RATING
59th/ 347
METRIC RANK
29.3%
BIRTHS TO UNMARRIED WOMEN
95.7/ 100
METRIC RATING
97th/ 347
METRIC RANK
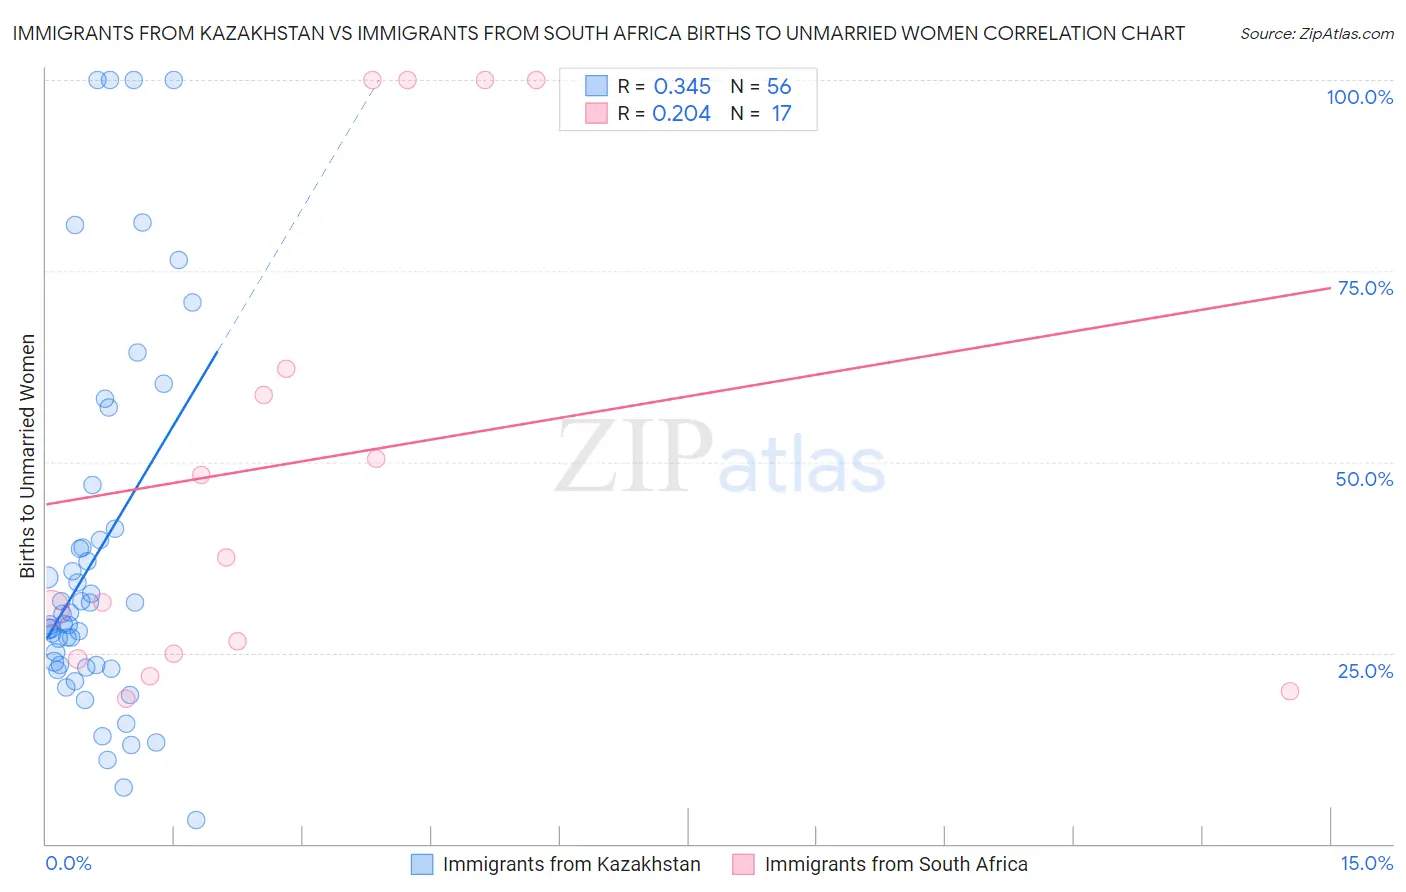
Immigrants from Kazakhstan vs Immigrants from South Africa Births to Unmarried Women Correlation Chart
The statistical analysis conducted on geographies consisting of 120,028,218 people shows a mild positive correlation between the proportion of Immigrants from Kazakhstan and percentage of births to unmarried women in the United States with a correlation coefficient (R) of 0.345 and weighted average of 28.1%. Similarly, the statistical analysis conducted on geographies consisting of 219,322,992 people shows a weak positive correlation between the proportion of Immigrants from South Africa and percentage of births to unmarried women in the United States with a correlation coefficient (R) of 0.204 and weighted average of 29.3%, a difference of 4.4%.
Births to Unmarried Women Correlation Summary
| Measurement | Immigrants from Kazakhstan | Immigrants from South Africa |
| Minimum | 3.1% | 19.0% |
| Maximum | 100.0% | 100.0% |
| Range | 96.9% | 81.0% |
| Mean | 37.8% | 50.4% |
| Median | 29.4% | 37.5% |
| Interquartile 25% (IQ1) | 23.2% | 24.5% |
| Interquartile 75% (IQ3) | 40.5% | 81.1% |
| Interquartile Range (IQR) | 17.2% | 56.6% |
| Standard Deviation (Sample) | 24.5% | 31.2% |
| Standard Deviation (Population) | 24.3% | 30.3% |
Similar Demographics by Births to Unmarried Women
Demographics Similar to Immigrants from Kazakhstan by Births to Unmarried Women
In terms of births to unmarried women, the demographic groups most similar to Immigrants from Kazakhstan are Immigrants from Turkey (28.1%, a difference of 0.040%), Immigrants from North Macedonia (28.1%, a difference of 0.090%), Immigrants from Albania (28.0%, a difference of 0.25%), Russian (28.0%, a difference of 0.36%), and Egyptian (28.2%, a difference of 0.41%).
| Demographics | Rating | Rank | Births to Unmarried Women |
| Bhutanese | 99.4 /100 | #52 | Exceptional 27.9% |
| Immigrants | Romania | 99.4 /100 | #53 | Exceptional 27.9% |
| Afghans | 99.4 /100 | #54 | Exceptional 27.9% |
| Mongolians | 99.3 /100 | #55 | Exceptional 27.9% |
| Immigrants | Belgium | 99.3 /100 | #56 | Exceptional 28.0% |
| Russians | 99.2 /100 | #57 | Exceptional 28.0% |
| Immigrants | Albania | 99.2 /100 | #58 | Exceptional 28.0% |
| Immigrants | Kazakhstan | 99.1 /100 | #59 | Exceptional 28.1% |
| Immigrants | Turkey | 99.1 /100 | #60 | Exceptional 28.1% |
| Immigrants | North Macedonia | 99.1 /100 | #61 | Exceptional 28.1% |
| Egyptians | 99.0 /100 | #62 | Exceptional 28.2% |
| Immigrants | Serbia | 98.9 /100 | #63 | Exceptional 28.3% |
| Tongans | 98.8 /100 | #64 | Exceptional 28.4% |
| Immigrants | Czechoslovakia | 98.8 /100 | #65 | Exceptional 28.4% |
| Immigrants | Egypt | 98.8 /100 | #66 | Exceptional 28.4% |
Demographics Similar to Immigrants from South Africa by Births to Unmarried Women
In terms of births to unmarried women, the demographic groups most similar to Immigrants from South Africa are Immigrants from Syria (29.4%, a difference of 0.020%), Norwegian (29.3%, a difference of 0.040%), Immigrants from Denmark (29.4%, a difference of 0.26%), Luxembourger (29.4%, a difference of 0.26%), and Immigrants from Vietnam (29.3%, a difference of 0.27%).
| Demographics | Rating | Rank | Births to Unmarried Women |
| Immigrants | Latvia | 96.8 /100 | #90 | Exceptional 29.1% |
| Immigrants | Fiji | 96.6 /100 | #91 | Exceptional 29.2% |
| Arabs | 96.5 /100 | #92 | Exceptional 29.2% |
| Estonians | 96.5 /100 | #93 | Exceptional 29.2% |
| Ukrainians | 96.3 /100 | #94 | Exceptional 29.2% |
| Immigrants | Vietnam | 96.1 /100 | #95 | Exceptional 29.3% |
| Norwegians | 95.8 /100 | #96 | Exceptional 29.3% |
| Immigrants | South Africa | 95.7 /100 | #97 | Exceptional 29.3% |
| Immigrants | Syria | 95.7 /100 | #98 | Exceptional 29.4% |
| Immigrants | Denmark | 95.3 /100 | #99 | Exceptional 29.4% |
| Luxembourgers | 95.2 /100 | #100 | Exceptional 29.4% |
| Immigrants | Northern Africa | 94.7 /100 | #101 | Exceptional 29.5% |
| Australians | 94.6 /100 | #102 | Exceptional 29.5% |
| Lebanese | 94.4 /100 | #103 | Exceptional 29.5% |
| Lithuanians | 94.4 /100 | #104 | Exceptional 29.6% |