Immigrants from Japan vs Immigrants from Southern Europe Single Father Households
COMPARE
Immigrants from Japan
Immigrants from Southern Europe
Single Father Households
Single Father Households Comparison
Immigrants from Japan
Immigrants from Southern Europe
2.0%
SINGLE FATHER HOUSEHOLDS
100.0/ 100
METRIC RATING
28th/ 347
METRIC RANK
2.2%
SINGLE FATHER HOUSEHOLDS
98.6/ 100
METRIC RATING
106th/ 347
METRIC RANK
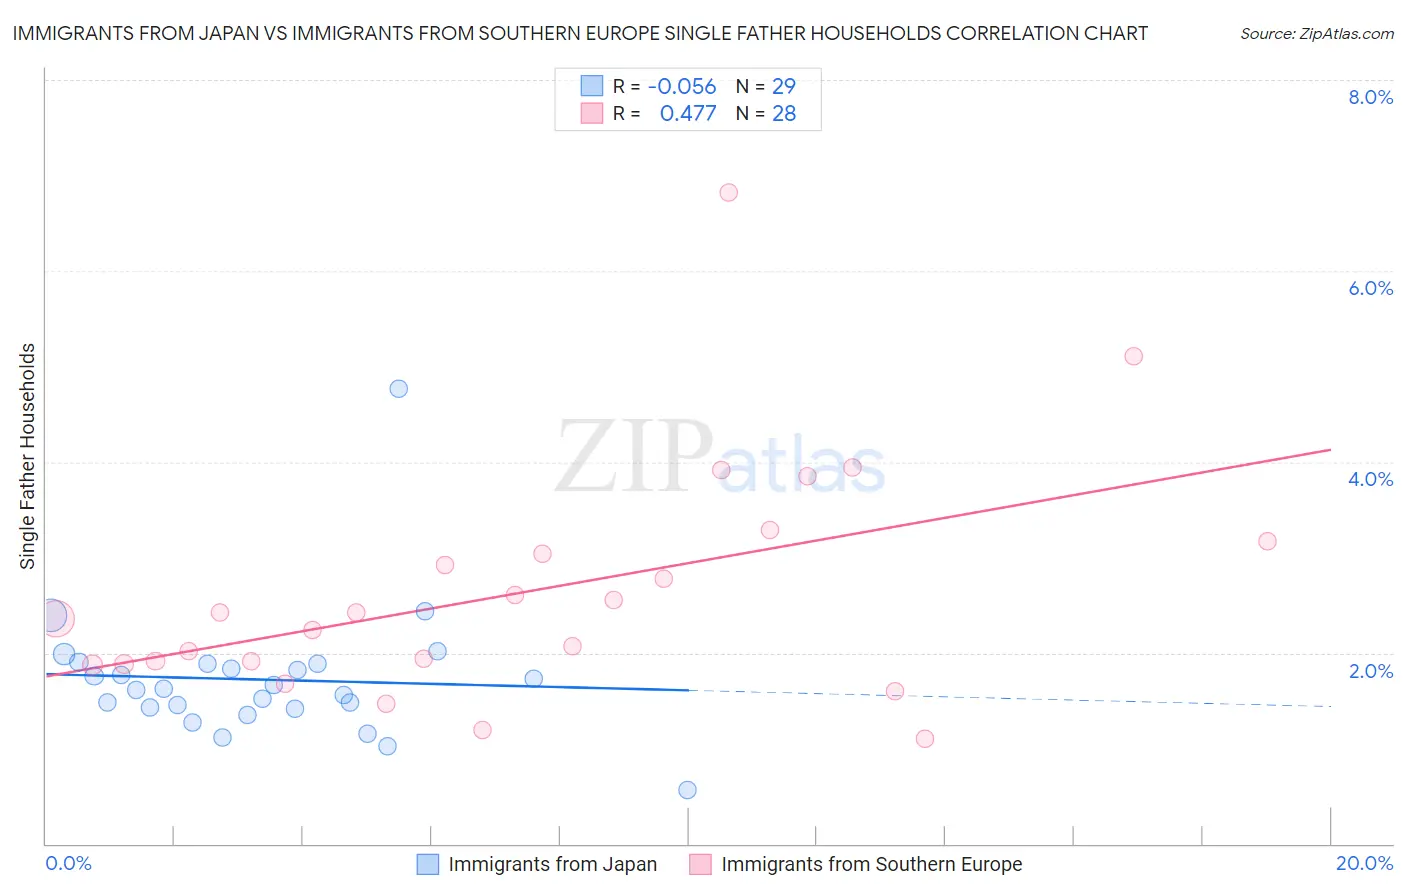
Immigrants from Japan vs Immigrants from Southern Europe Single Father Households Correlation Chart
The statistical analysis conducted on geographies consisting of 337,808,657 people shows a slight negative correlation between the proportion of Immigrants from Japan and percentage of single father households in the United States with a correlation coefficient (R) of -0.056 and weighted average of 2.0%. Similarly, the statistical analysis conducted on geographies consisting of 398,387,388 people shows a moderate positive correlation between the proportion of Immigrants from Southern Europe and percentage of single father households in the United States with a correlation coefficient (R) of 0.477 and weighted average of 2.2%, a difference of 9.5%.
Single Father Households Correlation Summary
| Measurement | Immigrants from Japan | Immigrants from Southern Europe |
| Minimum | 0.57% | 1.1% |
| Maximum | 4.8% | 6.8% |
| Range | 4.2% | 5.7% |
| Mean | 1.7% | 2.6% |
| Median | 1.6% | 2.4% |
| Interquartile 25% (IQ1) | 1.4% | 1.9% |
| Interquartile 75% (IQ3) | 1.9% | 3.1% |
| Interquartile Range (IQR) | 0.46% | 1.2% |
| Standard Deviation (Sample) | 0.70% | 1.2% |
| Standard Deviation (Population) | 0.69% | 1.2% |
Similar Demographics by Single Father Households
Demographics Similar to Immigrants from Japan by Single Father Households
In terms of single father households, the demographic groups most similar to Immigrants from Japan are Bulgarian (2.0%, a difference of 0.090%), Cambodian (2.0%, a difference of 0.11%), Israeli (2.0%, a difference of 0.14%), Immigrants from South Central Asia (2.0%, a difference of 0.18%), and Chinese (2.0%, a difference of 0.18%).
| Demographics | Rating | Rank | Single Father Households |
| Immigrants | Albania | 100.0 /100 | #21 | Exceptional 1.9% |
| Immigrants | Latvia | 100.0 /100 | #22 | Exceptional 1.9% |
| Immigrants | Croatia | 100.0 /100 | #23 | Exceptional 2.0% |
| Immigrants | Russia | 100.0 /100 | #24 | Exceptional 2.0% |
| Eastern Europeans | 100.0 /100 | #25 | Exceptional 2.0% |
| Assyrians/Chaldeans/Syriacs | 100.0 /100 | #26 | Exceptional 2.0% |
| Immigrants | South Central Asia | 100.0 /100 | #27 | Exceptional 2.0% |
| Immigrants | Japan | 100.0 /100 | #28 | Exceptional 2.0% |
| Bulgarians | 100.0 /100 | #29 | Exceptional 2.0% |
| Cambodians | 100.0 /100 | #30 | Exceptional 2.0% |
| Israelis | 100.0 /100 | #31 | Exceptional 2.0% |
| Chinese | 100.0 /100 | #32 | Exceptional 2.0% |
| Turks | 100.0 /100 | #33 | Exceptional 2.0% |
| Immigrants | Australia | 100.0 /100 | #34 | Exceptional 2.0% |
| Albanians | 100.0 /100 | #35 | Exceptional 2.0% |
Demographics Similar to Immigrants from Southern Europe by Single Father Households
In terms of single father households, the demographic groups most similar to Immigrants from Southern Europe are Palestinian (2.2%, a difference of 0.11%), Slovene (2.2%, a difference of 0.11%), Immigrants from Netherlands (2.2%, a difference of 0.14%), Barbadian (2.2%, a difference of 0.17%), and Italian (2.2%, a difference of 0.30%).
| Demographics | Rating | Rank | Single Father Households |
| South Africans | 99.1 /100 | #99 | Exceptional 2.1% |
| Immigrants | Northern Africa | 99.0 /100 | #100 | Exceptional 2.1% |
| Immigrants | Western Europe | 98.9 /100 | #101 | Exceptional 2.1% |
| Argentineans | 98.9 /100 | #102 | Exceptional 2.1% |
| Lebanese | 98.9 /100 | #103 | Exceptional 2.1% |
| Alsatians | 98.9 /100 | #104 | Exceptional 2.1% |
| Palestinians | 98.6 /100 | #105 | Exceptional 2.2% |
| Immigrants | Southern Europe | 98.6 /100 | #106 | Exceptional 2.2% |
| Slovenes | 98.5 /100 | #107 | Exceptional 2.2% |
| Immigrants | Netherlands | 98.5 /100 | #108 | Exceptional 2.2% |
| Barbadians | 98.4 /100 | #109 | Exceptional 2.2% |
| Italians | 98.3 /100 | #110 | Exceptional 2.2% |
| Immigrants | Canada | 98.3 /100 | #111 | Exceptional 2.2% |
| Immigrants | Trinidad and Tobago | 98.2 /100 | #112 | Exceptional 2.2% |
| Iraqis | 98.2 /100 | #113 | Exceptional 2.2% |