Immigrants from Japan vs Immigrants from South Africa Currently Married
COMPARE
Immigrants from Japan
Immigrants from South Africa
Currently Married
Currently Married Comparison
Immigrants from Japan
Immigrants from South Africa
48.0%
CURRENTLY MARRIED
96.2/ 100
METRIC RATING
86th/ 347
METRIC RANK
48.1%
CURRENTLY MARRIED
97.0/ 100
METRIC RATING
79th/ 347
METRIC RANK
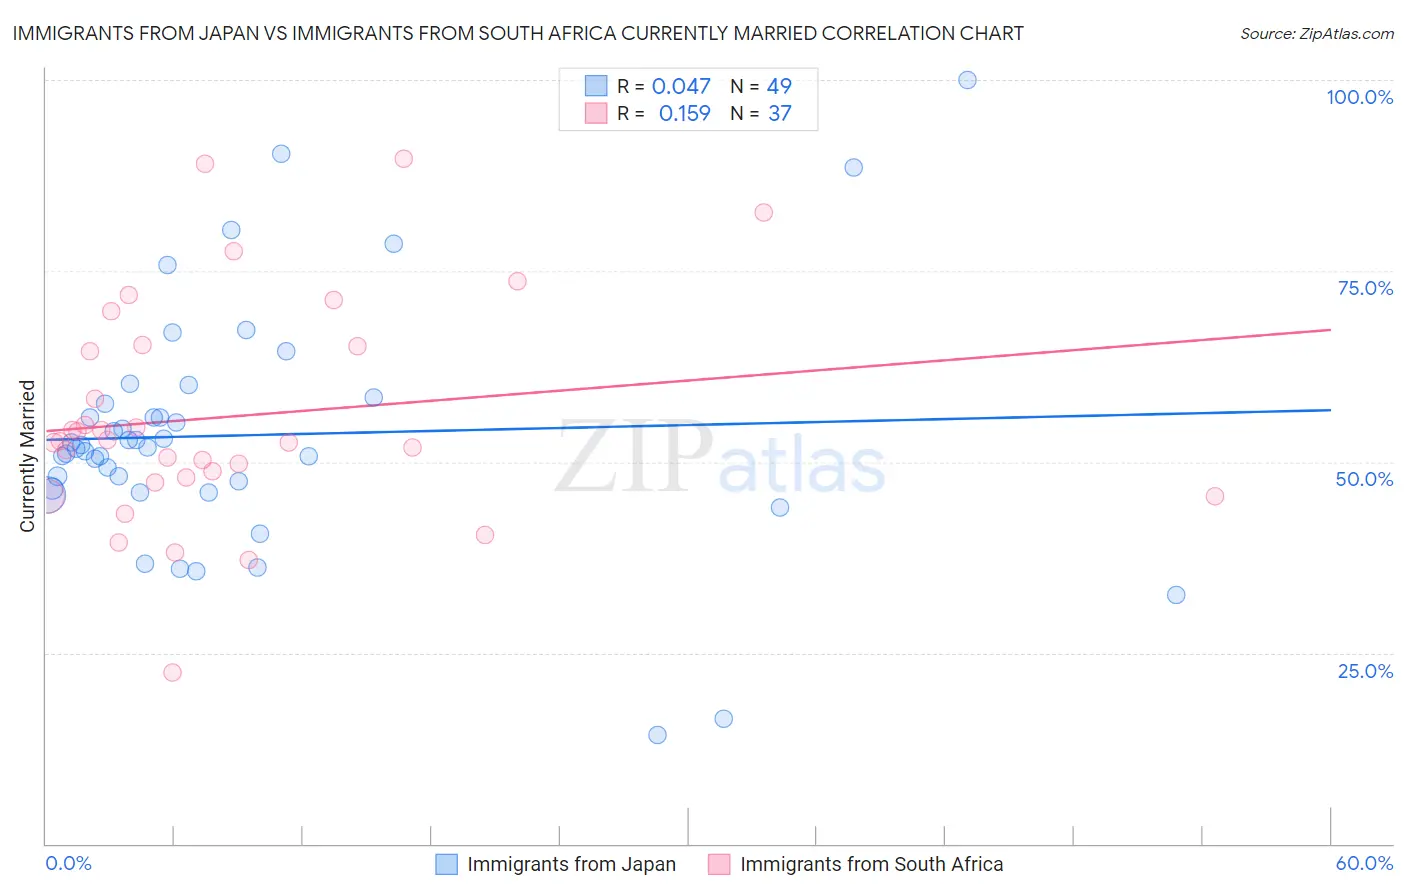
Immigrants from Japan vs Immigrants from South Africa Currently Married Correlation Chart
The statistical analysis conducted on geographies consisting of 340,094,815 people shows no correlation between the proportion of Immigrants from Japan and percentage of population currently married in the United States with a correlation coefficient (R) of 0.047 and weighted average of 48.0%. Similarly, the statistical analysis conducted on geographies consisting of 233,308,336 people shows a poor positive correlation between the proportion of Immigrants from South Africa and percentage of population currently married in the United States with a correlation coefficient (R) of 0.159 and weighted average of 48.1%, a difference of 0.22%.
Currently Married Correlation Summary
| Measurement | Immigrants from Japan | Immigrants from South Africa |
| Minimum | 14.3% | 22.4% |
| Maximum | 100.0% | 89.7% |
| Range | 85.7% | 67.3% |
| Mean | 53.5% | 55.9% |
| Median | 51.9% | 52.7% |
| Interquartile 25% (IQ1) | 46.2% | 47.6% |
| Interquartile 75% (IQ3) | 58.1% | 65.2% |
| Interquartile Range (IQR) | 11.8% | 17.6% |
| Standard Deviation (Sample) | 16.1% | 14.6% |
| Standard Deviation (Population) | 15.9% | 14.4% |
Demographics Similar to Immigrants from Japan and Immigrants from South Africa by Currently Married
In terms of currently married, the demographic groups most similar to Immigrants from Japan are Jordanian (48.0%, a difference of 0.010%), French Canadian (48.0%, a difference of 0.030%), Immigrants from Eastern Europe (48.0%, a difference of 0.030%), Indian (Asian) (48.0%, a difference of 0.090%), and American (48.0%, a difference of 0.11%). Similarly, the demographic groups most similar to Immigrants from South Africa are Immigrants from Belgium (48.1%, a difference of 0.010%), Slovene (48.1%, a difference of 0.020%), Immigrants from Poland (48.1%, a difference of 0.030%), Basque (48.1%, a difference of 0.040%), and Immigrants from Sri Lanka (48.1%, a difference of 0.040%).
| Demographics | Rating | Rank | Currently Married |
| Immigrants | Lebanon | 97.6 /100 | #72 | Exceptional 48.2% |
| Immigrants | Eastern Asia | 97.5 /100 | #73 | Exceptional 48.2% |
| Estonians | 97.4 /100 | #74 | Exceptional 48.2% |
| Immigrants | Belarus | 97.2 /100 | #75 | Exceptional 48.1% |
| Basques | 97.2 /100 | #76 | Exceptional 48.1% |
| Slovenes | 97.1 /100 | #77 | Exceptional 48.1% |
| Immigrants | Belgium | 97.1 /100 | #78 | Exceptional 48.1% |
| Immigrants | South Africa | 97.0 /100 | #79 | Exceptional 48.1% |
| Immigrants | Poland | 96.9 /100 | #80 | Exceptional 48.1% |
| Immigrants | Sri Lanka | 96.9 /100 | #81 | Exceptional 48.1% |
| Immigrants | Europe | 96.9 /100 | #82 | Exceptional 48.1% |
| Bolivians | 96.9 /100 | #83 | Exceptional 48.1% |
| Immigrants | Israel | 96.9 /100 | #84 | Exceptional 48.1% |
| French Canadians | 96.3 /100 | #85 | Exceptional 48.0% |
| Immigrants | Japan | 96.2 /100 | #86 | Exceptional 48.0% |
| Jordanians | 96.2 /100 | #87 | Exceptional 48.0% |
| Immigrants | Eastern Europe | 96.1 /100 | #88 | Exceptional 48.0% |
| Indians (Asian) | 95.8 /100 | #89 | Exceptional 48.0% |
| Americans | 95.7 /100 | #90 | Exceptional 48.0% |
| Immigrants | Bolivia | 95.6 /100 | #91 | Exceptional 47.9% |
| Koreans | 95.4 /100 | #92 | Exceptional 47.9% |