Immigrants from Italy vs American Single Mother Households
COMPARE
Immigrants from Italy
American
Single Mother Households
Single Mother Households Comparison
Immigrants from Italy
Americans
5.8%
SINGLE MOTHER HOUSEHOLDS
95.8/ 100
METRIC RATING
108th/ 347
METRIC RANK
6.6%
SINGLE MOTHER HOUSEHOLDS
19.0/ 100
METRIC RATING
192nd/ 347
METRIC RANK
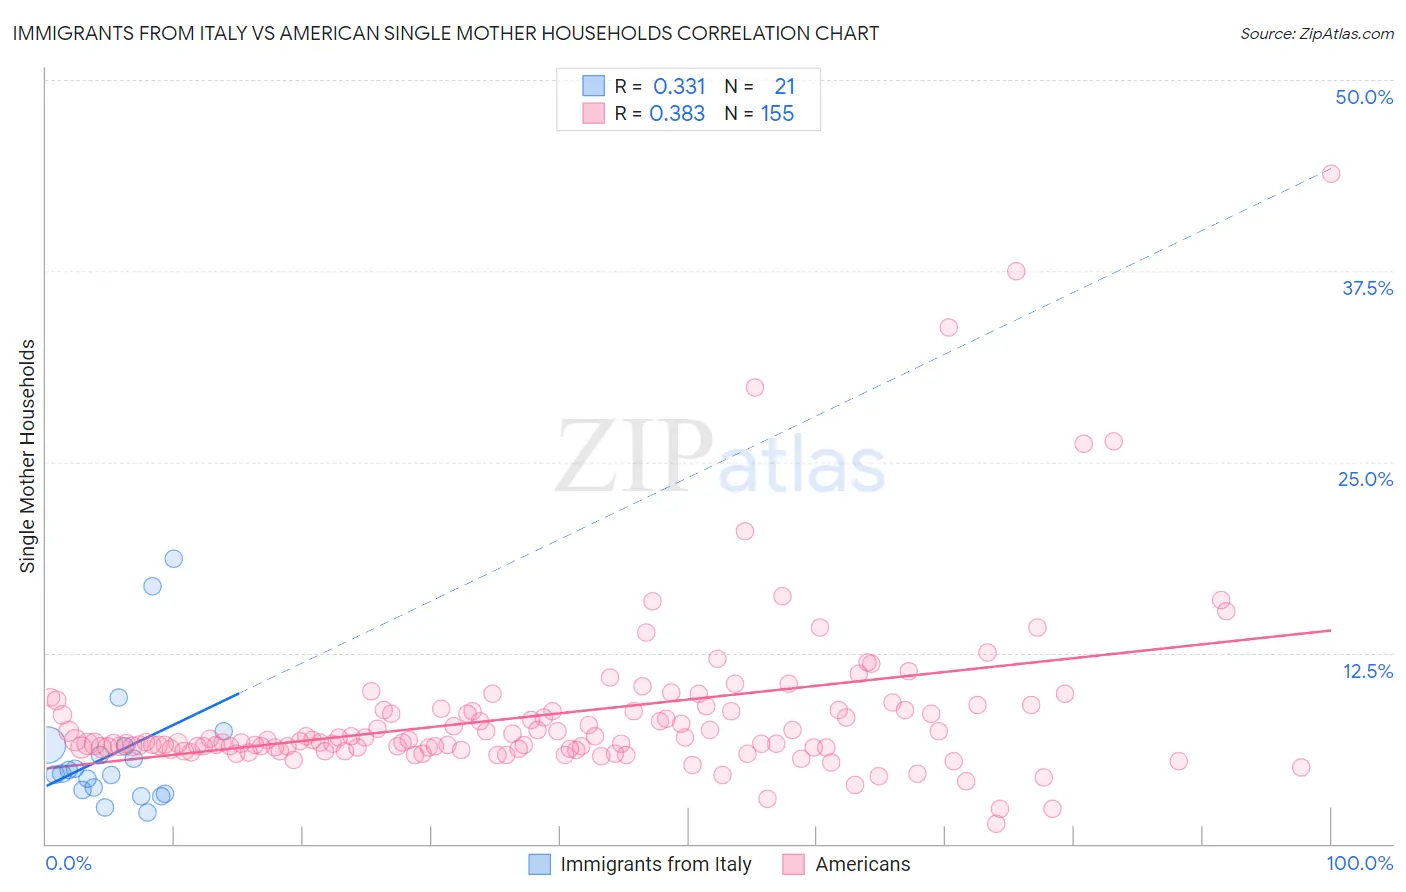
Immigrants from Italy vs American Single Mother Households Correlation Chart
The statistical analysis conducted on geographies consisting of 323,232,887 people shows a mild positive correlation between the proportion of Immigrants from Italy and percentage of single mother households in the United States with a correlation coefficient (R) of 0.331 and weighted average of 5.8%. Similarly, the statistical analysis conducted on geographies consisting of 575,485,944 people shows a mild positive correlation between the proportion of Americans and percentage of single mother households in the United States with a correlation coefficient (R) of 0.383 and weighted average of 6.6%, a difference of 13.7%.
Single Mother Households Correlation Summary
| Measurement | Immigrants from Italy | American |
| Minimum | 2.0% | 1.3% |
| Maximum | 18.6% | 43.9% |
| Range | 16.6% | 42.6% |
| Mean | 6.0% | 8.5% |
| Median | 4.6% | 6.7% |
| Interquartile 25% (IQ1) | 3.4% | 6.3% |
| Interquartile 75% (IQ3) | 6.4% | 8.7% |
| Interquartile Range (IQR) | 3.0% | 2.5% |
| Standard Deviation (Sample) | 4.3% | 5.7% |
| Standard Deviation (Population) | 4.2% | 5.7% |
Similar Demographics by Single Mother Households
Demographics Similar to Immigrants from Italy by Single Mother Households
In terms of single mother households, the demographic groups most similar to Immigrants from Italy are Paraguayan (5.8%, a difference of 0.010%), Immigrants from Western Europe (5.8%, a difference of 0.090%), Immigrants from Ukraine (5.8%, a difference of 0.12%), British (5.8%, a difference of 0.18%), and Immigrants from England (5.8%, a difference of 0.21%).
| Demographics | Rating | Rank | Single Mother Households |
| Germans | 96.2 /100 | #101 | Exceptional 5.8% |
| English | 96.2 /100 | #102 | Exceptional 5.8% |
| Scottish | 96.2 /100 | #103 | Exceptional 5.8% |
| Northern Europeans | 96.2 /100 | #104 | Exceptional 5.8% |
| Taiwanese | 96.1 /100 | #105 | Exceptional 5.8% |
| Immigrants | Ukraine | 95.9 /100 | #106 | Exceptional 5.8% |
| Paraguayans | 95.8 /100 | #107 | Exceptional 5.8% |
| Immigrants | Italy | 95.8 /100 | #108 | Exceptional 5.8% |
| Immigrants | Western Europe | 95.7 /100 | #109 | Exceptional 5.8% |
| British | 95.5 /100 | #110 | Exceptional 5.8% |
| Immigrants | England | 95.5 /100 | #111 | Exceptional 5.8% |
| Immigrants | Kuwait | 95.4 /100 | #112 | Exceptional 5.8% |
| Mongolians | 95.3 /100 | #113 | Exceptional 5.8% |
| Dutch | 95.1 /100 | #114 | Exceptional 5.8% |
| Irish | 94.8 /100 | #115 | Exceptional 5.8% |
Demographics Similar to Americans by Single Mother Households
In terms of single mother households, the demographic groups most similar to Americans are Colombian (6.6%, a difference of 0.11%), Immigrants from Uganda (6.6%, a difference of 0.12%), South American (6.6%, a difference of 0.17%), Uruguayan (6.6%, a difference of 0.17%), and Moroccan (6.6%, a difference of 0.27%).
| Demographics | Rating | Rank | Single Mother Households |
| Ugandans | 25.6 /100 | #185 | Fair 6.5% |
| Costa Ricans | 24.8 /100 | #186 | Fair 6.5% |
| Immigrants | Afghanistan | 24.7 /100 | #187 | Fair 6.5% |
| Ottawa | 23.8 /100 | #188 | Fair 6.5% |
| Delaware | 23.3 /100 | #189 | Fair 6.5% |
| Peruvians | 21.6 /100 | #190 | Fair 6.5% |
| Samoans | 21.2 /100 | #191 | Fair 6.5% |
| Americans | 19.0 /100 | #192 | Poor 6.6% |
| Colombians | 18.3 /100 | #193 | Poor 6.6% |
| Immigrants | Uganda | 18.3 /100 | #194 | Poor 6.6% |
| South Americans | 18.0 /100 | #195 | Poor 6.6% |
| Uruguayans | 18.0 /100 | #196 | Poor 6.6% |
| Moroccans | 17.4 /100 | #197 | Poor 6.6% |
| Hawaiians | 16.1 /100 | #198 | Poor 6.6% |
| Potawatomi | 15.5 /100 | #199 | Poor 6.6% |