Immigrants from Ireland vs French Single Mother Households
COMPARE
Immigrants from Ireland
French
Single Mother Households
Single Mother Households Comparison
Immigrants from Ireland
French
5.0%
SINGLE MOTHER HOUSEHOLDS
99.9/ 100
METRIC RATING
8th/ 347
METRIC RANK
6.0%
SINGLE MOTHER HOUSEHOLDS
85.7/ 100
METRIC RATING
140th/ 347
METRIC RANK
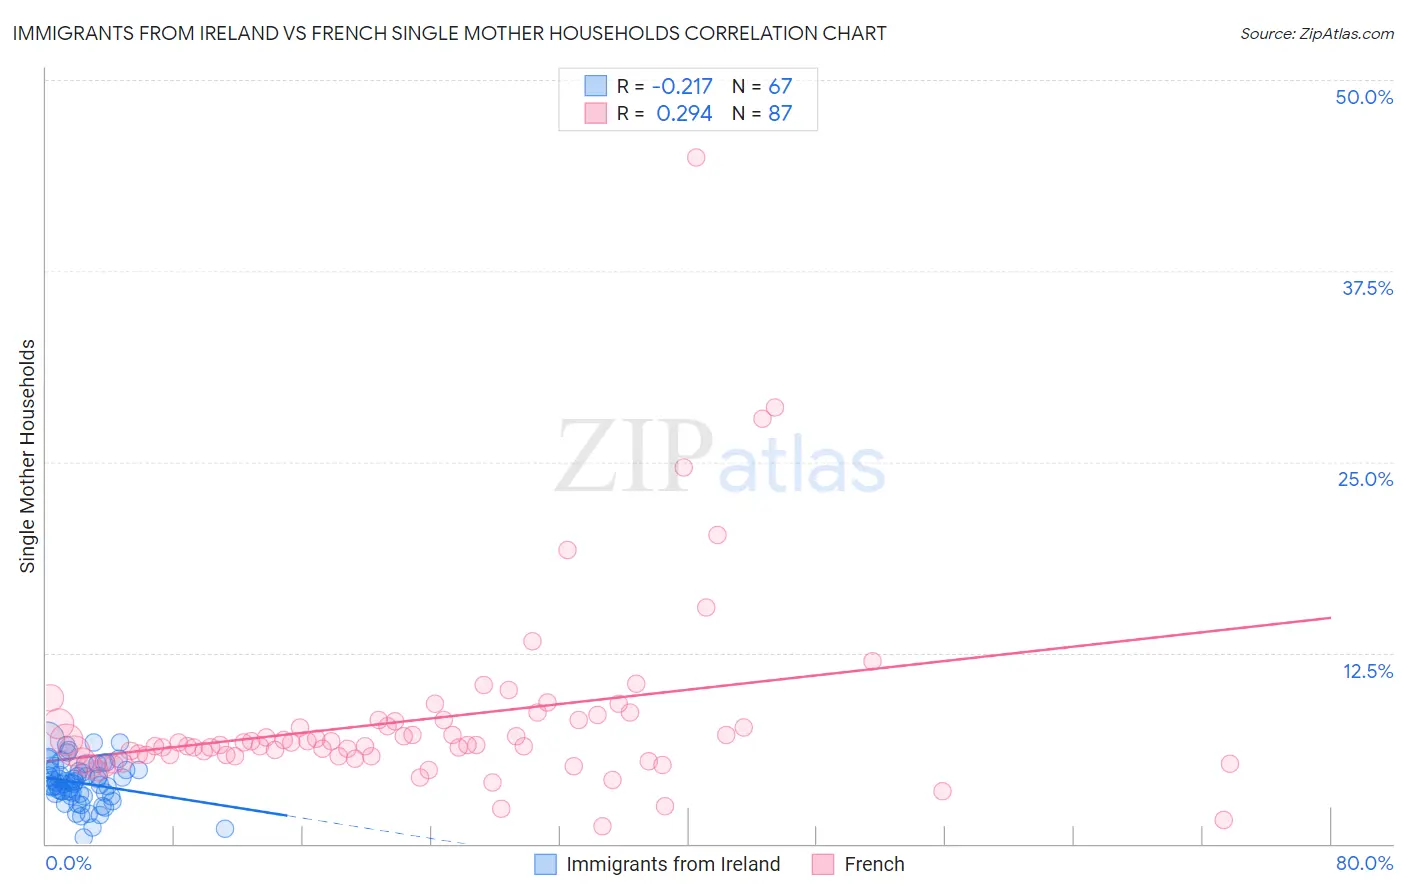
Immigrants from Ireland vs French Single Mother Households Correlation Chart
The statistical analysis conducted on geographies consisting of 240,180,229 people shows a weak negative correlation between the proportion of Immigrants from Ireland and percentage of single mother households in the United States with a correlation coefficient (R) of -0.217 and weighted average of 5.0%. Similarly, the statistical analysis conducted on geographies consisting of 566,908,036 people shows a weak positive correlation between the proportion of French and percentage of single mother households in the United States with a correlation coefficient (R) of 0.294 and weighted average of 6.0%, a difference of 20.0%.
Single Mother Households Correlation Summary
| Measurement | Immigrants from Ireland | French |
| Minimum | 0.40% | 1.2% |
| Maximum | 6.8% | 44.9% |
| Range | 6.4% | 43.7% |
| Mean | 4.0% | 8.1% |
| Median | 4.0% | 6.5% |
| Interquartile 25% (IQ1) | 3.2% | 5.8% |
| Interquartile 75% (IQ3) | 4.8% | 8.1% |
| Interquartile Range (IQR) | 1.6% | 2.3% |
| Standard Deviation (Sample) | 1.4% | 6.2% |
| Standard Deviation (Population) | 1.4% | 6.1% |
Similar Demographics by Single Mother Households
Demographics Similar to Immigrants from Ireland by Single Mother Households
In terms of single mother households, the demographic groups most similar to Immigrants from Ireland are Okinawan (5.0%, a difference of 0.15%), Immigrants from Israel (5.0%, a difference of 0.49%), Iranian (5.0%, a difference of 0.66%), Immigrants from Singapore (5.0%, a difference of 0.91%), and Immigrants from China (5.1%, a difference of 1.1%).
| Demographics | Rating | Rank | Single Mother Households |
| Immigrants | Taiwan | 100.0 /100 | #1 | Exceptional 4.7% |
| Filipinos | 100.0 /100 | #2 | Exceptional 4.7% |
| Immigrants | Iran | 100.0 /100 | #3 | Exceptional 4.8% |
| Assyrians/Chaldeans/Syriacs | 100.0 /100 | #4 | Exceptional 4.8% |
| Immigrants | Hong Kong | 100.0 /100 | #5 | Exceptional 4.8% |
| Immigrants | Singapore | 100.0 /100 | #6 | Exceptional 5.0% |
| Iranians | 100.0 /100 | #7 | Exceptional 5.0% |
| Immigrants | Ireland | 99.9 /100 | #8 | Exceptional 5.0% |
| Okinawans | 99.9 /100 | #9 | Exceptional 5.0% |
| Immigrants | Israel | 99.9 /100 | #10 | Exceptional 5.0% |
| Immigrants | China | 99.9 /100 | #11 | Exceptional 5.1% |
| Cypriots | 99.9 /100 | #12 | Exceptional 5.1% |
| Immigrants | India | 99.9 /100 | #13 | Exceptional 5.1% |
| Immigrants | Australia | 99.9 /100 | #14 | Exceptional 5.1% |
| Immigrants | Eastern Asia | 99.9 /100 | #15 | Exceptional 5.1% |
Demographics Similar to French by Single Mother Households
In terms of single mother households, the demographic groups most similar to French are Syrian (6.0%, a difference of 0.070%), Tsimshian (6.0%, a difference of 0.10%), Immigrants from Egypt (6.0%, a difference of 0.15%), Immigrants from Iraq (6.0%, a difference of 0.19%), and Korean (6.0%, a difference of 0.29%).
| Demographics | Rating | Rank | Single Mother Households |
| Egyptians | 90.7 /100 | #133 | Exceptional 5.9% |
| Canadians | 90.5 /100 | #134 | Exceptional 5.9% |
| Immigrants | Saudi Arabia | 90.2 /100 | #135 | Exceptional 5.9% |
| Jordanians | 88.9 /100 | #136 | Excellent 6.0% |
| Immigrants | Pakistan | 88.4 /100 | #137 | Excellent 6.0% |
| Icelanders | 86.9 /100 | #138 | Excellent 6.0% |
| Syrians | 86.0 /100 | #139 | Excellent 6.0% |
| French | 85.7 /100 | #140 | Excellent 6.0% |
| Tsimshian | 85.2 /100 | #141 | Excellent 6.0% |
| Immigrants | Egypt | 85.0 /100 | #142 | Excellent 6.0% |
| Immigrants | Iraq | 84.8 /100 | #143 | Excellent 6.0% |
| Koreans | 84.4 /100 | #144 | Excellent 6.0% |
| Arabs | 84.0 /100 | #145 | Excellent 6.0% |
| French Canadians | 82.6 /100 | #146 | Excellent 6.0% |
| Immigrants | Jordan | 82.3 /100 | #147 | Excellent 6.0% |