Immigrants from Ireland vs Cypriot Average Family Size
COMPARE
Immigrants from Ireland
Cypriot
Average Family Size
Average Family Size Comparison
Immigrants from Ireland
Cypriots
3.13
AVERAGE FAMILY SIZE
0.1/ 100
METRIC RATING
306th/ 347
METRIC RANK
3.14
AVERAGE FAMILY SIZE
0.3/ 100
METRIC RATING
290th/ 347
METRIC RANK
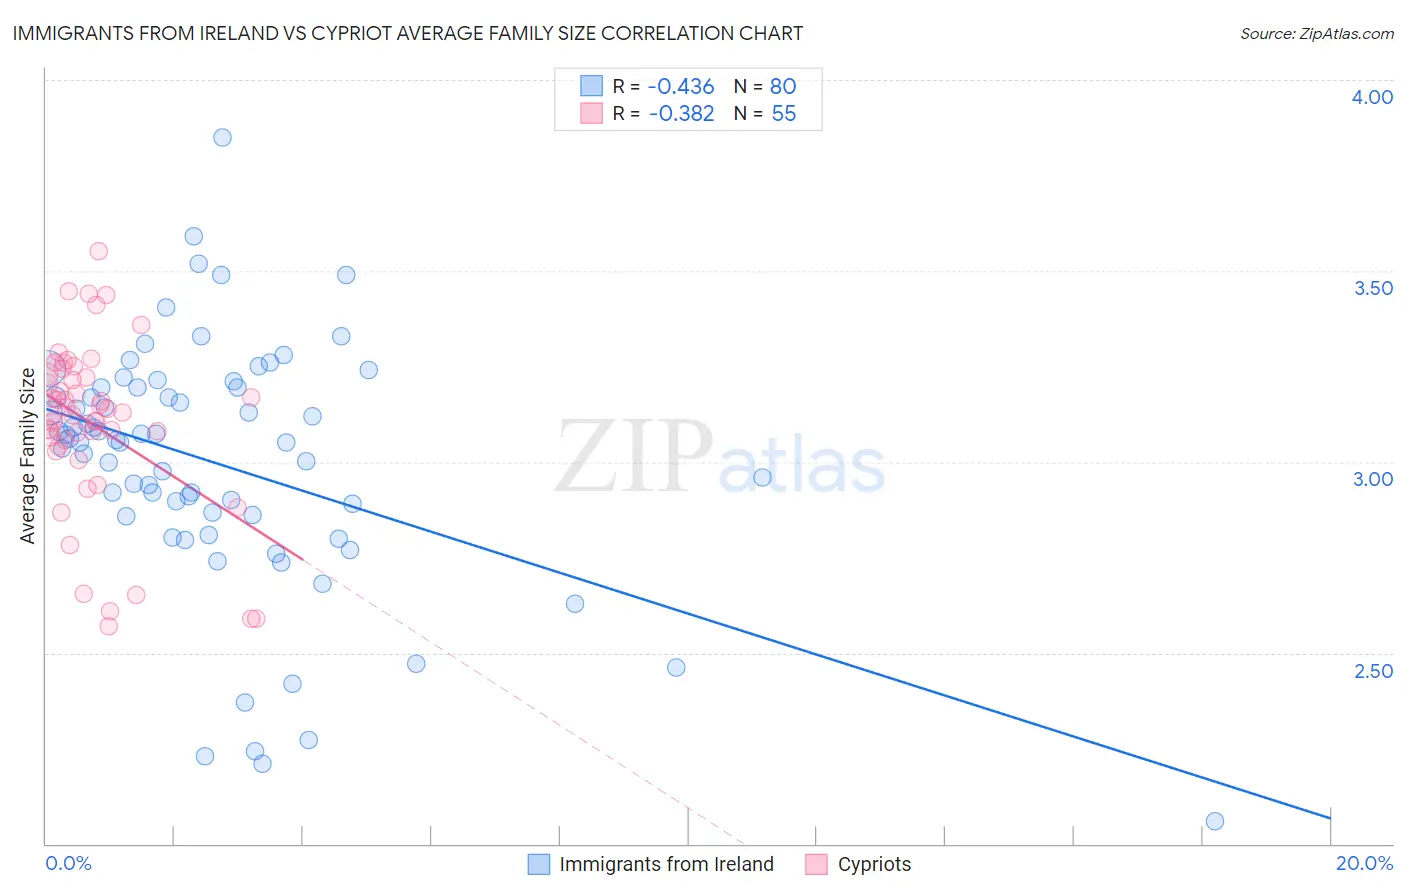
Immigrants from Ireland vs Cypriot Average Family Size Correlation Chart
The statistical analysis conducted on geographies consisting of 240,751,818 people shows a moderate negative correlation between the proportion of Immigrants from Ireland and average family size in the United States with a correlation coefficient (R) of -0.436 and weighted average of 3.13. Similarly, the statistical analysis conducted on geographies consisting of 61,854,678 people shows a mild negative correlation between the proportion of Cypriots and average family size in the United States with a correlation coefficient (R) of -0.382 and weighted average of 3.14, a difference of 0.35%.
Average Family Size Correlation Summary
| Measurement | Immigrants from Ireland | Cypriot |
| Minimum | 2.06 | 2.57 |
| Maximum | 3.85 | 3.55 |
| Range | 1.79 | 0.98 |
| Mean | 2.99 | 3.10 |
| Median | 3.05 | 3.13 |
| Interquartile 25% (IQ1) | 2.86 | 3.04 |
| Interquartile 75% (IQ3) | 3.19 | 3.23 |
| Interquartile Range (IQR) | 0.34 | 0.19 |
| Standard Deviation (Sample) | 0.33 | 0.22 |
| Standard Deviation (Population) | 0.33 | 0.22 |
Demographics Similar to Immigrants from Ireland and Cypriots by Average Family Size
In terms of average family size, the demographic groups most similar to Immigrants from Ireland are Immigrants from Serbia (3.13, a difference of 0.010%), Slavic (3.13, a difference of 0.060%), Australian (3.13, a difference of 0.070%), Immigrants from Switzerland (3.13, a difference of 0.090%), and British (3.13, a difference of 0.11%). Similarly, the demographic groups most similar to Cypriots are Immigrants from Czechoslovakia (3.14, a difference of 0.030%), Immigrants from Norway (3.14, a difference of 0.030%), Alsatian (3.14, a difference of 0.040%), European (3.14, a difference of 0.060%), and Scandinavian (3.14, a difference of 0.070%).
| Demographics | Rating | Rank | Average Family Size |
| Immigrants | Czechoslovakia | 0.3 /100 | #288 | Tragic 3.14 |
| Immigrants | Norway | 0.3 /100 | #289 | Tragic 3.14 |
| Cypriots | 0.3 /100 | #290 | Tragic 3.14 |
| Alsatians | 0.2 /100 | #291 | Tragic 3.14 |
| Europeans | 0.2 /100 | #292 | Tragic 3.14 |
| Scandinavians | 0.2 /100 | #293 | Tragic 3.14 |
| Immigrants | Croatia | 0.2 /100 | #294 | Tragic 3.14 |
| Austrians | 0.2 /100 | #295 | Tragic 3.14 |
| Ukrainians | 0.2 /100 | #296 | Tragic 3.14 |
| Immigrants | Western Europe | 0.2 /100 | #297 | Tragic 3.14 |
| Colville | 0.2 /100 | #298 | Tragic 3.14 |
| Canadians | 0.2 /100 | #299 | Tragic 3.14 |
| Immigrants | Sweden | 0.2 /100 | #300 | Tragic 3.14 |
| Macedonians | 0.2 /100 | #301 | Tragic 3.13 |
| Immigrants | Latvia | 0.2 /100 | #302 | Tragic 3.13 |
| British | 0.2 /100 | #303 | Tragic 3.13 |
| Immigrants | Switzerland | 0.2 /100 | #304 | Tragic 3.13 |
| Australians | 0.1 /100 | #305 | Tragic 3.13 |
| Immigrants | Ireland | 0.1 /100 | #306 | Tragic 3.13 |
| Immigrants | Serbia | 0.1 /100 | #307 | Tragic 3.13 |
| Slavs | 0.1 /100 | #308 | Tragic 3.13 |