Immigrants from Iraq vs Immigrants from Korea Average Family Size
COMPARE
Immigrants from Iraq
Immigrants from Korea
Average Family Size
Average Family Size Comparison
Immigrants from Iraq
Immigrants from Korea
3.24
AVERAGE FAMILY SIZE
63.7/ 100
METRIC RATING
160th/ 347
METRIC RANK
3.23
AVERAGE FAMILY SIZE
46.9/ 100
METRIC RATING
179th/ 347
METRIC RANK
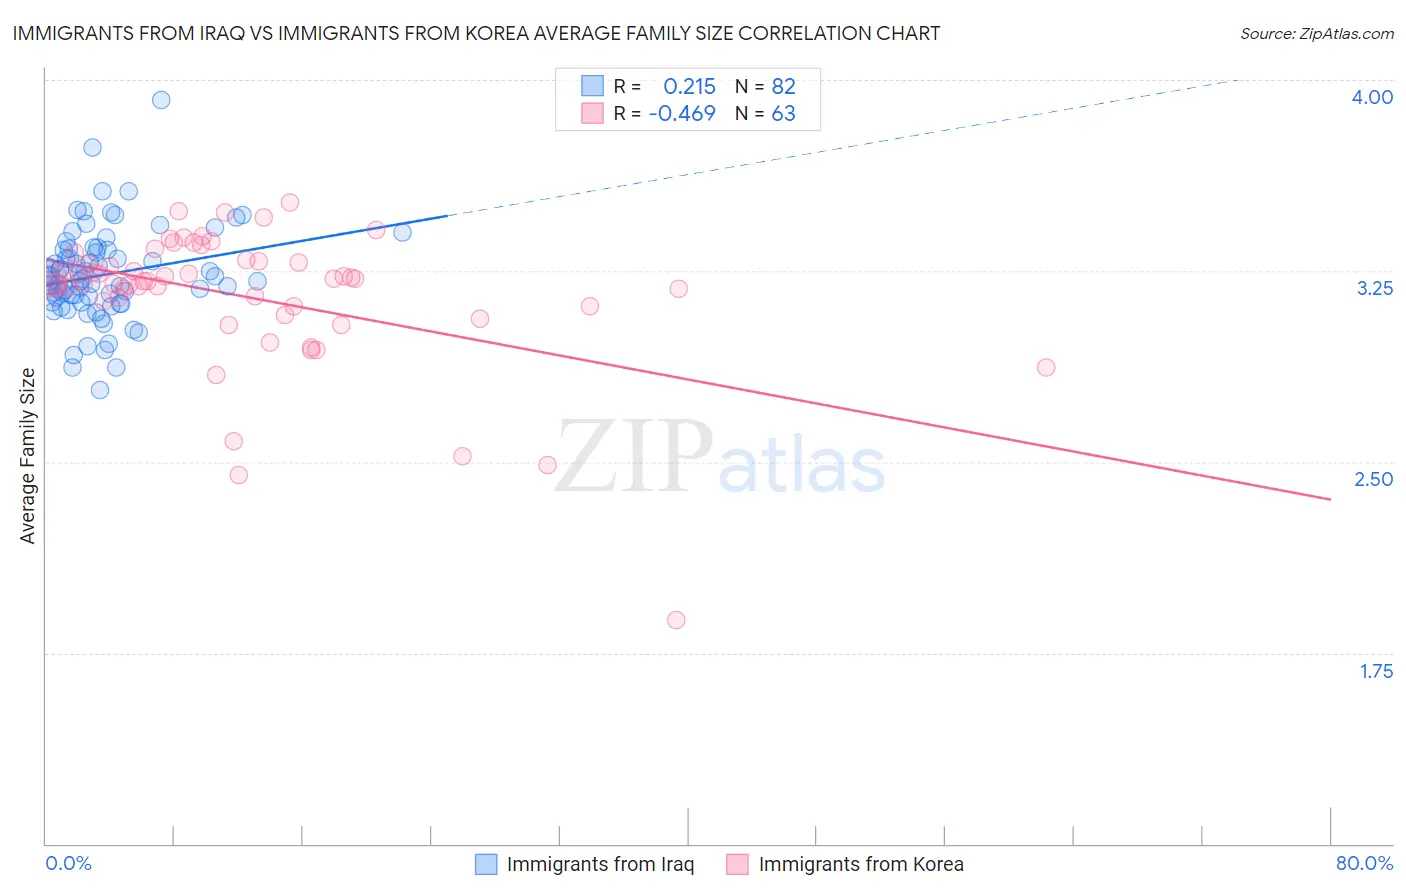
Immigrants from Iraq vs Immigrants from Korea Average Family Size Correlation Chart
The statistical analysis conducted on geographies consisting of 194,698,234 people shows a weak positive correlation between the proportion of Immigrants from Iraq and average family size in the United States with a correlation coefficient (R) of 0.215 and weighted average of 3.24. Similarly, the statistical analysis conducted on geographies consisting of 415,975,423 people shows a moderate negative correlation between the proportion of Immigrants from Korea and average family size in the United States with a correlation coefficient (R) of -0.469 and weighted average of 3.23, a difference of 0.31%.
Average Family Size Correlation Summary
| Measurement | Immigrants from Iraq | Immigrants from Korea |
| Minimum | 2.78 | 1.88 |
| Maximum | 3.92 | 3.52 |
| Range | 1.14 | 1.64 |
| Mean | 3.24 | 3.15 |
| Median | 3.21 | 3.21 |
| Interquartile 25% (IQ1) | 3.13 | 3.11 |
| Interquartile 75% (IQ3) | 3.33 | 3.29 |
| Interquartile Range (IQR) | 0.20 | 0.18 |
| Standard Deviation (Sample) | 0.19 | 0.28 |
| Standard Deviation (Population) | 0.18 | 0.27 |
Demographics Similar to Immigrants from Iraq and Immigrants from Korea by Average Family Size
In terms of average family size, the demographic groups most similar to Immigrants from Iraq are Ethiopian (3.24, a difference of 0.010%), Immigrants from Chile (3.24, a difference of 0.010%), Immigrants from Uganda (3.23, a difference of 0.070%), Uruguayan (3.23, a difference of 0.090%), and Egyptian (3.23, a difference of 0.10%). Similarly, the demographic groups most similar to Immigrants from Korea are Argentinean (3.23, a difference of 0.010%), Spaniard (3.23, a difference of 0.010%), Israeli (3.23, a difference of 0.030%), Immigrants from China (3.23, a difference of 0.050%), and Immigrants from South Central Asia (3.23, a difference of 0.060%).
| Demographics | Rating | Rank | Average Family Size |
| Ethiopians | 63.9 /100 | #159 | Good 3.24 |
| Immigrants | Iraq | 63.7 /100 | #160 | Good 3.24 |
| Immigrants | Chile | 63.2 /100 | #161 | Good 3.24 |
| Immigrants | Uganda | 60.1 /100 | #162 | Good 3.23 |
| Uruguayans | 58.8 /100 | #163 | Average 3.23 |
| Egyptians | 58.6 /100 | #164 | Average 3.23 |
| Ugandans | 58.4 /100 | #165 | Average 3.23 |
| Immigrants | Senegal | 57.5 /100 | #166 | Average 3.23 |
| Dutch West Indians | 56.9 /100 | #167 | Average 3.23 |
| Taiwanese | 54.2 /100 | #168 | Average 3.23 |
| Aleuts | 54.1 /100 | #169 | Average 3.23 |
| Arabs | 53.8 /100 | #170 | Average 3.23 |
| Chileans | 53.2 /100 | #171 | Average 3.23 |
| Immigrants | Congo | 52.7 /100 | #172 | Average 3.23 |
| Immigrants | Uruguay | 52.0 /100 | #173 | Average 3.23 |
| Immigrants | South Central Asia | 50.0 /100 | #174 | Average 3.23 |
| Immigrants | China | 49.9 /100 | #175 | Average 3.23 |
| Israelis | 48.7 /100 | #176 | Average 3.23 |
| Argentineans | 47.4 /100 | #177 | Average 3.23 |
| Spaniards | 47.2 /100 | #178 | Average 3.23 |
| Immigrants | Korea | 46.9 /100 | #179 | Average 3.23 |