Immigrants from Iraq vs Immigrants from Haiti Currently Married
COMPARE
Immigrants from Iraq
Immigrants from Haiti
Currently Married
Currently Married Comparison
Immigrants from Iraq
Immigrants from Haiti
47.3%
CURRENTLY MARRIED
82.8/ 100
METRIC RATING
130th/ 347
METRIC RANK
41.0%
CURRENTLY MARRIED
0.0/ 100
METRIC RATING
322nd/ 347
METRIC RANK
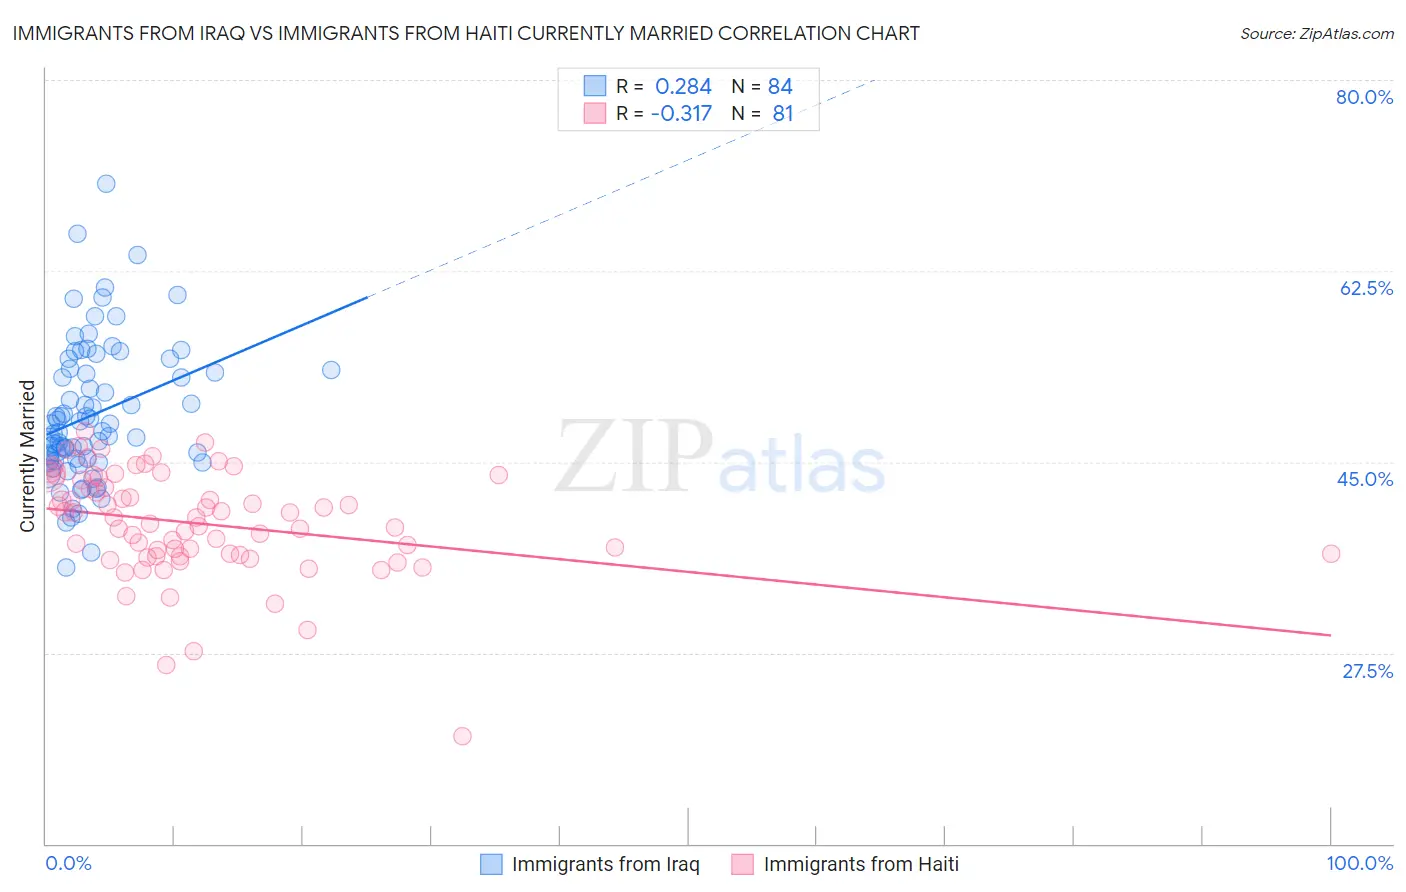
Immigrants from Iraq vs Immigrants from Haiti Currently Married Correlation Chart
The statistical analysis conducted on geographies consisting of 194,780,853 people shows a weak positive correlation between the proportion of Immigrants from Iraq and percentage of population currently married in the United States with a correlation coefficient (R) of 0.284 and weighted average of 47.3%. Similarly, the statistical analysis conducted on geographies consisting of 225,264,174 people shows a mild negative correlation between the proportion of Immigrants from Haiti and percentage of population currently married in the United States with a correlation coefficient (R) of -0.317 and weighted average of 41.0%, a difference of 15.4%.
Currently Married Correlation Summary
| Measurement | Immigrants from Iraq | Immigrants from Haiti |
| Minimum | 35.4% | 19.9% |
| Maximum | 70.5% | 47.8% |
| Range | 35.1% | 27.9% |
| Mean | 49.3% | 39.3% |
| Median | 48.1% | 39.9% |
| Interquartile 25% (IQ1) | 45.2% | 36.4% |
| Interquartile 75% (IQ3) | 53.5% | 43.5% |
| Interquartile Range (IQR) | 8.3% | 7.1% |
| Standard Deviation (Sample) | 6.5% | 4.9% |
| Standard Deviation (Population) | 6.4% | 4.9% |
Similar Demographics by Currently Married
Demographics Similar to Immigrants from Iraq by Currently Married
In terms of currently married, the demographic groups most similar to Immigrants from Iraq are Icelander (47.3%, a difference of 0.020%), Sri Lankan (47.3%, a difference of 0.030%), Afghan (47.3%, a difference of 0.060%), Portuguese (47.3%, a difference of 0.090%), and Immigrants from Malaysia (47.3%, a difference of 0.10%).
| Demographics | Rating | Rank | Currently Married |
| Immigrants | Kazakhstan | 87.2 /100 | #123 | Excellent 47.4% |
| Laotians | 86.6 /100 | #124 | Excellent 47.4% |
| Okinawans | 85.3 /100 | #125 | Excellent 47.4% |
| Immigrants | Jordan | 84.9 /100 | #126 | Excellent 47.4% |
| New Zealanders | 84.9 /100 | #127 | Excellent 47.4% |
| Portuguese | 84.2 /100 | #128 | Excellent 47.3% |
| Sri Lankans | 83.2 /100 | #129 | Excellent 47.3% |
| Immigrants | Iraq | 82.8 /100 | #130 | Excellent 47.3% |
| Icelanders | 82.4 /100 | #131 | Excellent 47.3% |
| Afghans | 81.8 /100 | #132 | Excellent 47.3% |
| Immigrants | Malaysia | 81.1 /100 | #133 | Excellent 47.3% |
| Immigrants | Australia | 81.1 /100 | #134 | Excellent 47.3% |
| Immigrants | Norway | 79.7 /100 | #135 | Good 47.2% |
| Immigrants | Vietnam | 78.2 /100 | #136 | Good 47.2% |
| Paraguayans | 77.8 /100 | #137 | Good 47.2% |
Demographics Similar to Immigrants from Haiti by Currently Married
In terms of currently married, the demographic groups most similar to Immigrants from Haiti are Immigrants from Congo (41.1%, a difference of 0.13%), Immigrants from Jamaica (41.1%, a difference of 0.36%), Immigrants from Somalia (41.2%, a difference of 0.43%), Bahamian (41.2%, a difference of 0.44%), and Haitian (41.3%, a difference of 0.63%).
| Demographics | Rating | Rank | Currently Married |
| Inupiat | 0.0 /100 | #315 | Tragic 41.3% |
| Immigrants | Caribbean | 0.0 /100 | #316 | Tragic 41.3% |
| Haitians | 0.0 /100 | #317 | Tragic 41.3% |
| Bahamians | 0.0 /100 | #318 | Tragic 41.2% |
| Immigrants | Somalia | 0.0 /100 | #319 | Tragic 41.2% |
| Immigrants | Jamaica | 0.0 /100 | #320 | Tragic 41.1% |
| Immigrants | Congo | 0.0 /100 | #321 | Tragic 41.1% |
| Immigrants | Haiti | 0.0 /100 | #322 | Tragic 41.0% |
| Immigrants | West Indies | 0.0 /100 | #323 | Tragic 40.7% |
| Immigrants | Senegal | 0.0 /100 | #324 | Tragic 40.7% |
| U.S. Virgin Islanders | 0.0 /100 | #325 | Tragic 40.7% |
| Barbadians | 0.0 /100 | #326 | Tragic 40.6% |
| Senegalese | 0.0 /100 | #327 | Tragic 40.6% |
| Arapaho | 0.0 /100 | #328 | Tragic 40.5% |
| Crow | 0.0 /100 | #329 | Tragic 40.4% |