Immigrants from Iraq vs Burmese Family Households with Children
COMPARE
Immigrants from Iraq
Burmese
Family Households with Children
Family Households with Children Comparison
Immigrants from Iraq
Burmese
28.4%
FAMILY HOUSEHOLDS WITH CHILDREN
99.8/ 100
METRIC RATING
79th/ 347
METRIC RANK
28.5%
FAMILY HOUSEHOLDS WITH CHILDREN
99.9/ 100
METRIC RATING
71st/ 347
METRIC RANK
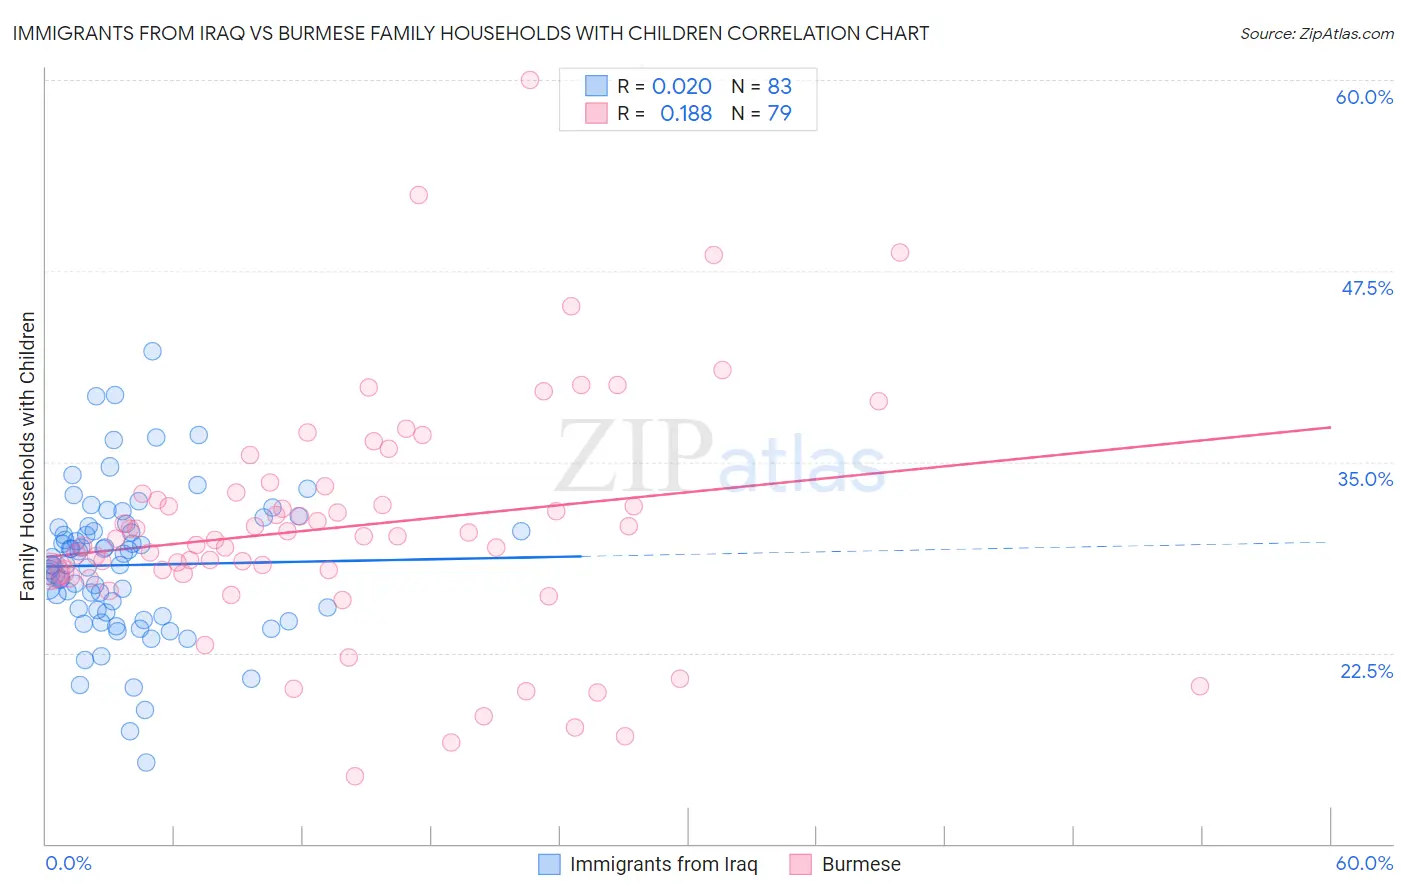
Immigrants from Iraq vs Burmese Family Households with Children Correlation Chart
The statistical analysis conducted on geographies consisting of 194,748,370 people shows no correlation between the proportion of Immigrants from Iraq and percentage of family households with children in the United States with a correlation coefficient (R) of 0.020 and weighted average of 28.4%. Similarly, the statistical analysis conducted on geographies consisting of 464,672,516 people shows a poor positive correlation between the proportion of Burmese and percentage of family households with children in the United States with a correlation coefficient (R) of 0.188 and weighted average of 28.5%, a difference of 0.31%.
Family Households with Children Correlation Summary
| Measurement | Immigrants from Iraq | Burmese |
| Minimum | 15.3% | 14.4% |
| Maximum | 42.3% | 60.0% |
| Range | 27.0% | 45.6% |
| Mean | 28.2% | 30.8% |
| Median | 28.2% | 30.1% |
| Interquartile 25% (IQ1) | 25.2% | 27.7% |
| Interquartile 75% (IQ3) | 30.7% | 33.0% |
| Interquartile Range (IQR) | 5.6% | 5.3% |
| Standard Deviation (Sample) | 4.8% | 7.8% |
| Standard Deviation (Population) | 4.7% | 7.8% |
Demographics Similar to Immigrants from Iraq and Burmese by Family Households with Children
In terms of family households with children, the demographic groups most similar to Immigrants from Iraq are Native/Alaskan (28.4%, a difference of 0.010%), Immigrants from Nepal (28.4%, a difference of 0.030%), South American (28.4%, a difference of 0.040%), Nigerian (28.4%, a difference of 0.070%), and Kenyan (28.4%, a difference of 0.080%). Similarly, the demographic groups most similar to Burmese are Immigrants from Honduras (28.5%, a difference of 0.010%), Immigrants from Indonesia (28.5%, a difference of 0.010%), Iraqi (28.5%, a difference of 0.040%), Laotian (28.5%, a difference of 0.060%), and Immigrants from Korea (28.5%, a difference of 0.070%).
| Demographics | Rating | Rank | Family Households with Children |
| Hondurans | 99.9 /100 | #65 | Exceptional 28.5% |
| Immigrants | Egypt | 99.9 /100 | #66 | Exceptional 28.5% |
| Ghanaians | 99.9 /100 | #67 | Exceptional 28.5% |
| Houma | 99.9 /100 | #68 | Exceptional 28.5% |
| Immigrants | Korea | 99.9 /100 | #69 | Exceptional 28.5% |
| Immigrants | Honduras | 99.9 /100 | #70 | Exceptional 28.5% |
| Burmese | 99.9 /100 | #71 | Exceptional 28.5% |
| Immigrants | Indonesia | 99.9 /100 | #72 | Exceptional 28.5% |
| Iraqis | 99.9 /100 | #73 | Exceptional 28.5% |
| Laotians | 99.9 /100 | #74 | Exceptional 28.5% |
| Immigrants | Jordan | 99.9 /100 | #75 | Exceptional 28.4% |
| Immigrants | Sri Lanka | 99.9 /100 | #76 | Exceptional 28.4% |
| Nigerians | 99.8 /100 | #77 | Exceptional 28.4% |
| Immigrants | Nepal | 99.8 /100 | #78 | Exceptional 28.4% |
| Immigrants | Iraq | 99.8 /100 | #79 | Exceptional 28.4% |
| Natives/Alaskans | 99.8 /100 | #80 | Exceptional 28.4% |
| South Americans | 99.8 /100 | #81 | Exceptional 28.4% |
| Kenyans | 99.8 /100 | #82 | Exceptional 28.4% |
| Nicaraguans | 99.8 /100 | #83 | Exceptional 28.4% |
| Costa Ricans | 99.8 /100 | #84 | Exceptional 28.4% |
| Immigrants | Syria | 99.8 /100 | #85 | Exceptional 28.4% |