Immigrants from Iran vs Immigrants from Japan Divorced or Separated
COMPARE
Immigrants from Iran
Immigrants from Japan
Divorced or Separated
Divorced or Separated Comparison
Immigrants from Iran
Immigrants from Japan
10.6%
DIVORCED OR SEPARATED
100.0/ 100
METRIC RATING
18th/ 347
METRIC RANK
11.1%
DIVORCED OR SEPARATED
100.0/ 100
METRIC RATING
36th/ 347
METRIC RANK
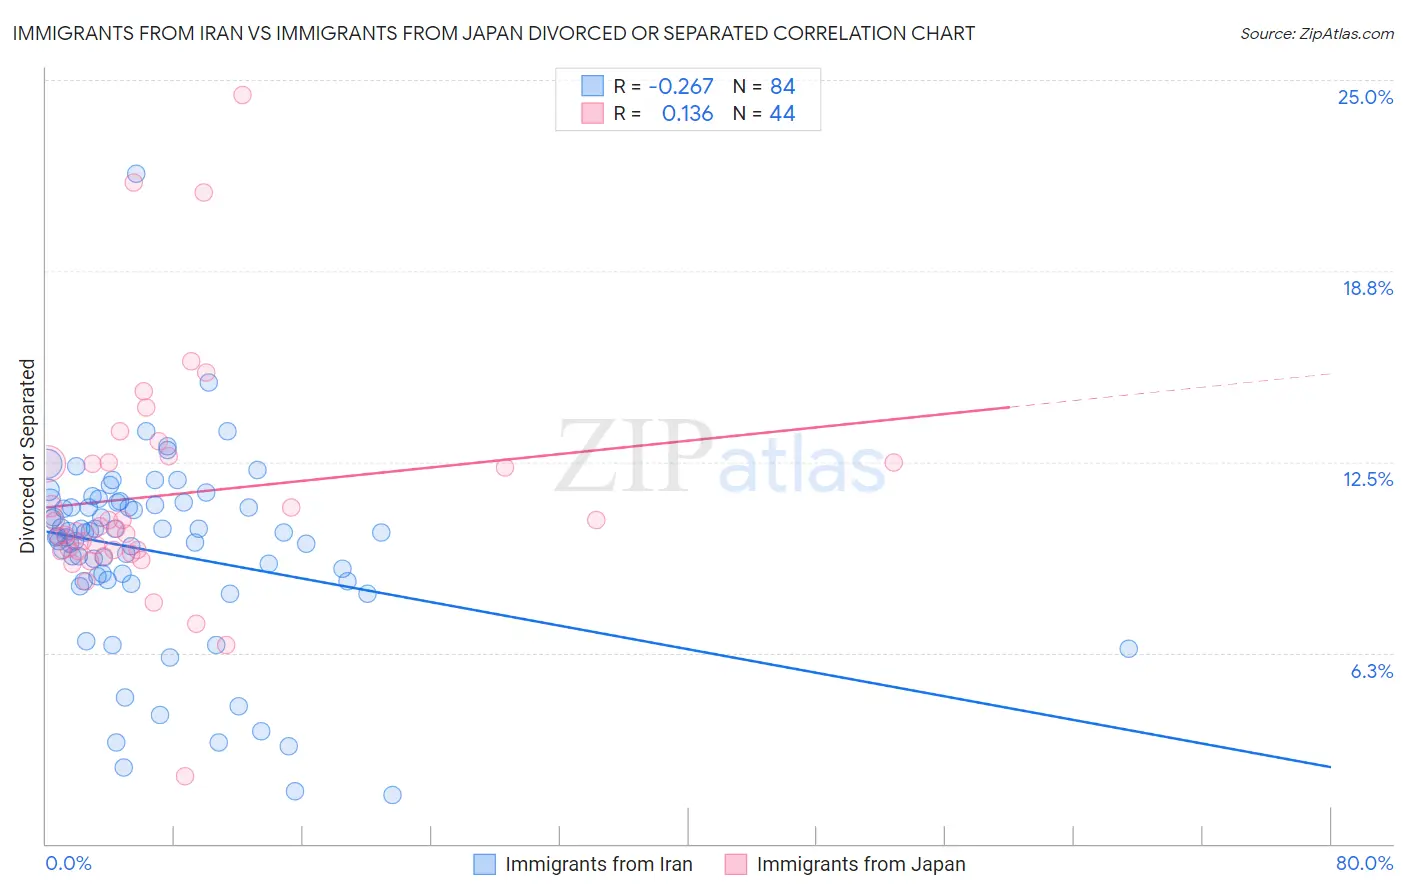
Immigrants from Iran vs Immigrants from Japan Divorced or Separated Correlation Chart
The statistical analysis conducted on geographies consisting of 279,868,346 people shows a weak negative correlation between the proportion of Immigrants from Iran and percentage of population currently divorced or separated in the United States with a correlation coefficient (R) of -0.267 and weighted average of 10.6%. Similarly, the statistical analysis conducted on geographies consisting of 340,021,973 people shows a poor positive correlation between the proportion of Immigrants from Japan and percentage of population currently divorced or separated in the United States with a correlation coefficient (R) of 0.136 and weighted average of 11.1%, a difference of 4.4%.
Divorced or Separated Correlation Summary
| Measurement | Immigrants from Iran | Immigrants from Japan |
| Minimum | 1.6% | 2.2% |
| Maximum | 21.9% | 24.5% |
| Range | 20.3% | 22.3% |
| Mean | 9.5% | 11.4% |
| Median | 10.1% | 10.4% |
| Interquartile 25% (IQ1) | 8.6% | 9.6% |
| Interquartile 75% (IQ3) | 11.1% | 12.5% |
| Interquartile Range (IQR) | 2.5% | 2.9% |
| Standard Deviation (Sample) | 3.1% | 3.9% |
| Standard Deviation (Population) | 3.1% | 3.8% |
Demographics Similar to Immigrants from Iran and Immigrants from Japan by Divorced or Separated
In terms of divorced or separated, the demographic groups most similar to Immigrants from Iran are Asian (10.6%, a difference of 0.0%), Immigrants from Israel (10.6%, a difference of 0.090%), Burmese (10.7%, a difference of 0.74%), Immigrants from Asia (10.7%, a difference of 0.93%), and Vietnamese (10.8%, a difference of 1.2%). Similarly, the demographic groups most similar to Immigrants from Japan are Immigrants from Lebanon (11.1%, a difference of 0.010%), Cambodian (11.1%, a difference of 0.060%), Immigrants from Uzbekistan (11.1%, a difference of 0.14%), Egyptian (11.1%, a difference of 0.21%), and Tongan (11.1%, a difference of 0.25%).
| Demographics | Rating | Rank | Divorced or Separated |
| Immigrants | Israel | 100.0 /100 | #17 | Exceptional 10.6% |
| Immigrants | Iran | 100.0 /100 | #18 | Exceptional 10.6% |
| Asians | 100.0 /100 | #19 | Exceptional 10.6% |
| Burmese | 100.0 /100 | #20 | Exceptional 10.7% |
| Immigrants | Asia | 100.0 /100 | #21 | Exceptional 10.7% |
| Vietnamese | 100.0 /100 | #22 | Exceptional 10.8% |
| Immigrants | Pakistan | 100.0 /100 | #23 | Exceptional 10.8% |
| Immigrants | Sri Lanka | 100.0 /100 | #24 | Exceptional 10.8% |
| Iranians | 100.0 /100 | #25 | Exceptional 10.8% |
| Immigrants | Indonesia | 100.0 /100 | #26 | Exceptional 10.9% |
| Immigrants | Bangladesh | 100.0 /100 | #27 | Exceptional 11.0% |
| Immigrants | Malaysia | 100.0 /100 | #28 | Exceptional 11.0% |
| Armenians | 100.0 /100 | #29 | Exceptional 11.0% |
| Immigrants | Ireland | 100.0 /100 | #30 | Exceptional 11.0% |
| Mongolians | 100.0 /100 | #31 | Exceptional 11.1% |
| Tongans | 100.0 /100 | #32 | Exceptional 11.1% |
| Egyptians | 100.0 /100 | #33 | Exceptional 11.1% |
| Immigrants | Uzbekistan | 100.0 /100 | #34 | Exceptional 11.1% |
| Cambodians | 100.0 /100 | #35 | Exceptional 11.1% |
| Immigrants | Japan | 100.0 /100 | #36 | Exceptional 11.1% |
| Immigrants | Lebanon | 100.0 /100 | #37 | Exceptional 11.1% |