Immigrants from Iran vs Hopi Single Father Households
COMPARE
Immigrants from Iran
Hopi
Single Father Households
Single Father Households Comparison
Immigrants from Iran
Hopi
1.9%
SINGLE FATHER HOUSEHOLDS
100.0/ 100
METRIC RATING
16th/ 347
METRIC RANK
2.8%
SINGLE FATHER HOUSEHOLDS
0.0/ 100
METRIC RATING
307th/ 347
METRIC RANK
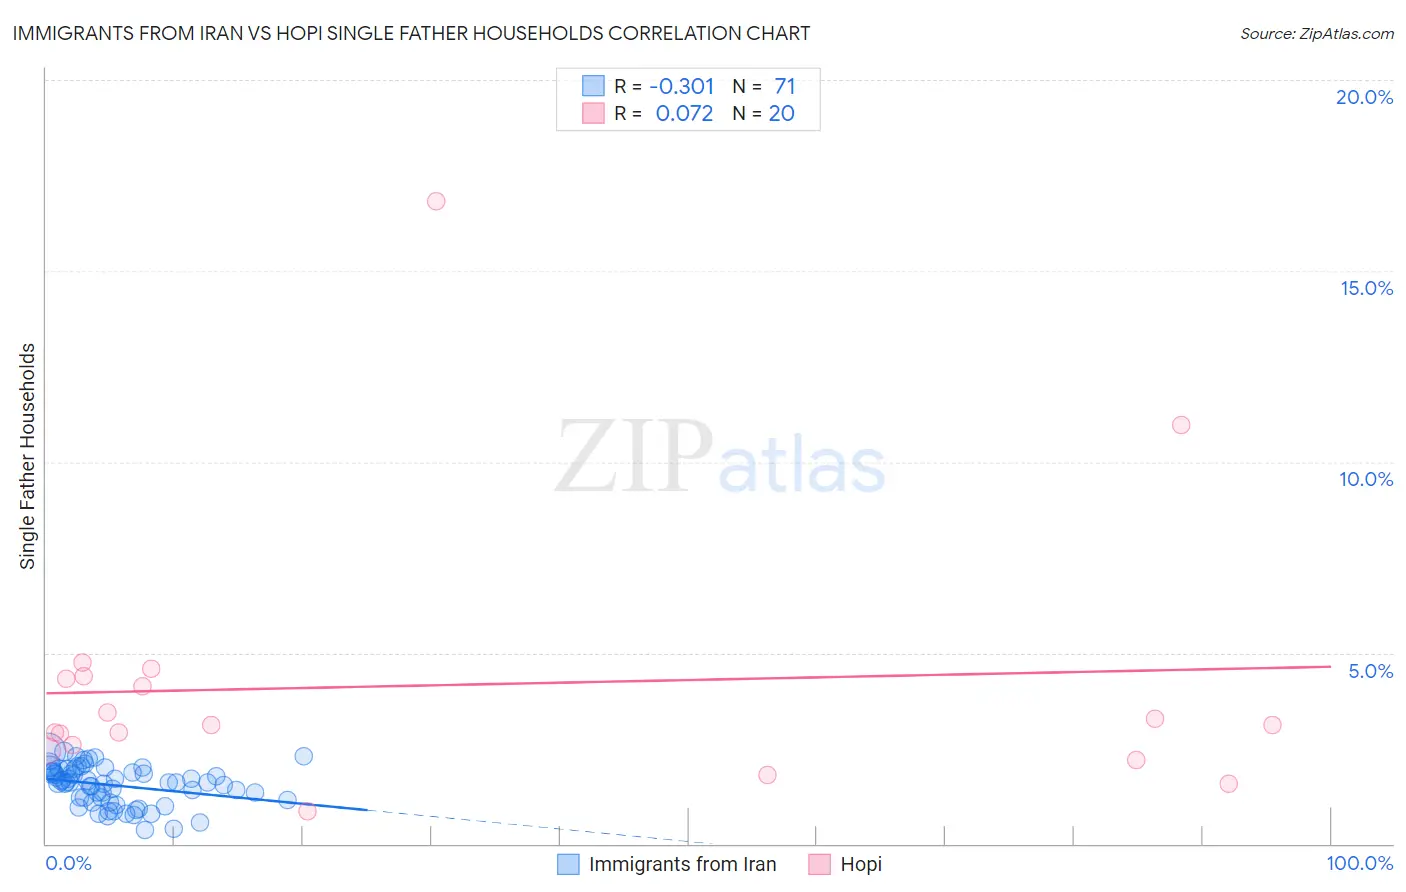
Immigrants from Iran vs Hopi Single Father Households Correlation Chart
The statistical analysis conducted on geographies consisting of 278,578,987 people shows a mild negative correlation between the proportion of Immigrants from Iran and percentage of single father households in the United States with a correlation coefficient (R) of -0.301 and weighted average of 1.9%. Similarly, the statistical analysis conducted on geographies consisting of 74,602,618 people shows a slight positive correlation between the proportion of Hopi and percentage of single father households in the United States with a correlation coefficient (R) of 0.072 and weighted average of 2.8%, a difference of 49.5%.
Single Father Households Correlation Summary
| Measurement | Immigrants from Iran | Hopi |
| Minimum | 0.34% | 0.84% |
| Maximum | 2.4% | 16.8% |
| Range | 2.1% | 16.0% |
| Mean | 1.5% | 4.2% |
| Median | 1.6% | 3.1% |
| Interquartile 25% (IQ1) | 1.1% | 2.5% |
| Interquartile 75% (IQ3) | 1.9% | 4.4% |
| Interquartile Range (IQR) | 0.74% | 1.9% |
| Standard Deviation (Sample) | 0.50% | 3.6% |
| Standard Deviation (Population) | 0.50% | 3.5% |
Similar Demographics by Single Father Households
Demographics Similar to Immigrants from Iran by Single Father Households
In terms of single father households, the demographic groups most similar to Immigrants from Iran are Immigrants from Eastern Asia (1.9%, a difference of 0.20%), Immigrants from India (1.9%, a difference of 0.23%), Immigrants from Lithuania (1.9%, a difference of 0.35%), Indian (Asian) (1.9%, a difference of 0.72%), and Immigrants from Singapore (1.9%, a difference of 1.3%).
| Demographics | Rating | Rank | Single Father Households |
| Immigrants | China | 100.0 /100 | #9 | Exceptional 1.8% |
| Okinawans | 100.0 /100 | #10 | Exceptional 1.9% |
| Immigrants | Belarus | 100.0 /100 | #11 | Exceptional 1.9% |
| Immigrants | Greece | 100.0 /100 | #12 | Exceptional 1.9% |
| Immigrants | Singapore | 100.0 /100 | #13 | Exceptional 1.9% |
| Immigrants | Lithuania | 100.0 /100 | #14 | Exceptional 1.9% |
| Immigrants | Eastern Asia | 100.0 /100 | #15 | Exceptional 1.9% |
| Immigrants | Iran | 100.0 /100 | #16 | Exceptional 1.9% |
| Immigrants | India | 100.0 /100 | #17 | Exceptional 1.9% |
| Indians (Asian) | 100.0 /100 | #18 | Exceptional 1.9% |
| Iranians | 100.0 /100 | #19 | Exceptional 1.9% |
| Thais | 100.0 /100 | #20 | Exceptional 1.9% |
| Immigrants | Albania | 100.0 /100 | #21 | Exceptional 1.9% |
| Immigrants | Latvia | 100.0 /100 | #22 | Exceptional 1.9% |
| Immigrants | Croatia | 100.0 /100 | #23 | Exceptional 2.0% |
Demographics Similar to Hopi by Single Father Households
In terms of single father households, the demographic groups most similar to Hopi are Immigrants from the Azores (2.8%, a difference of 0.17%), Apache (2.8%, a difference of 0.18%), Hispanic or Latino (2.8%, a difference of 0.32%), Mexican American Indian (2.8%, a difference of 0.48%), and Immigrants from Honduras (2.8%, a difference of 0.79%).
| Demographics | Rating | Rank | Single Father Households |
| Kiowa | 0.0 /100 | #300 | Tragic 2.8% |
| Immigrants | Latin America | 0.0 /100 | #301 | Tragic 2.8% |
| Spanish Americans | 0.0 /100 | #302 | Tragic 2.8% |
| Immigrants | Honduras | 0.0 /100 | #303 | Tragic 2.8% |
| Mexican American Indians | 0.0 /100 | #304 | Tragic 2.8% |
| Hispanics or Latinos | 0.0 /100 | #305 | Tragic 2.8% |
| Immigrants | Azores | 0.0 /100 | #306 | Tragic 2.8% |
| Hopi | 0.0 /100 | #307 | Tragic 2.8% |
| Apache | 0.0 /100 | #308 | Tragic 2.8% |
| Central Americans | 0.0 /100 | #309 | Tragic 2.9% |
| Immigrants | Laos | 0.0 /100 | #310 | Tragic 2.9% |
| Spanish American Indians | 0.0 /100 | #311 | Tragic 2.9% |
| Tsimshian | 0.0 /100 | #312 | Tragic 2.9% |
| Arapaho | 0.0 /100 | #313 | Tragic 2.9% |
| Salvadorans | 0.0 /100 | #314 | Tragic 2.9% |