Immigrants from India vs Nigerian Currently Married
COMPARE
Immigrants from India
Nigerian
Currently Married
Currently Married Comparison
Immigrants from India
Nigerians
51.8%
CURRENTLY MARRIED
100.0/ 100
METRIC RATING
1st/ 347
METRIC RANK
43.4%
CURRENTLY MARRIED
0.1/ 100
METRIC RATING
274th/ 347
METRIC RANK
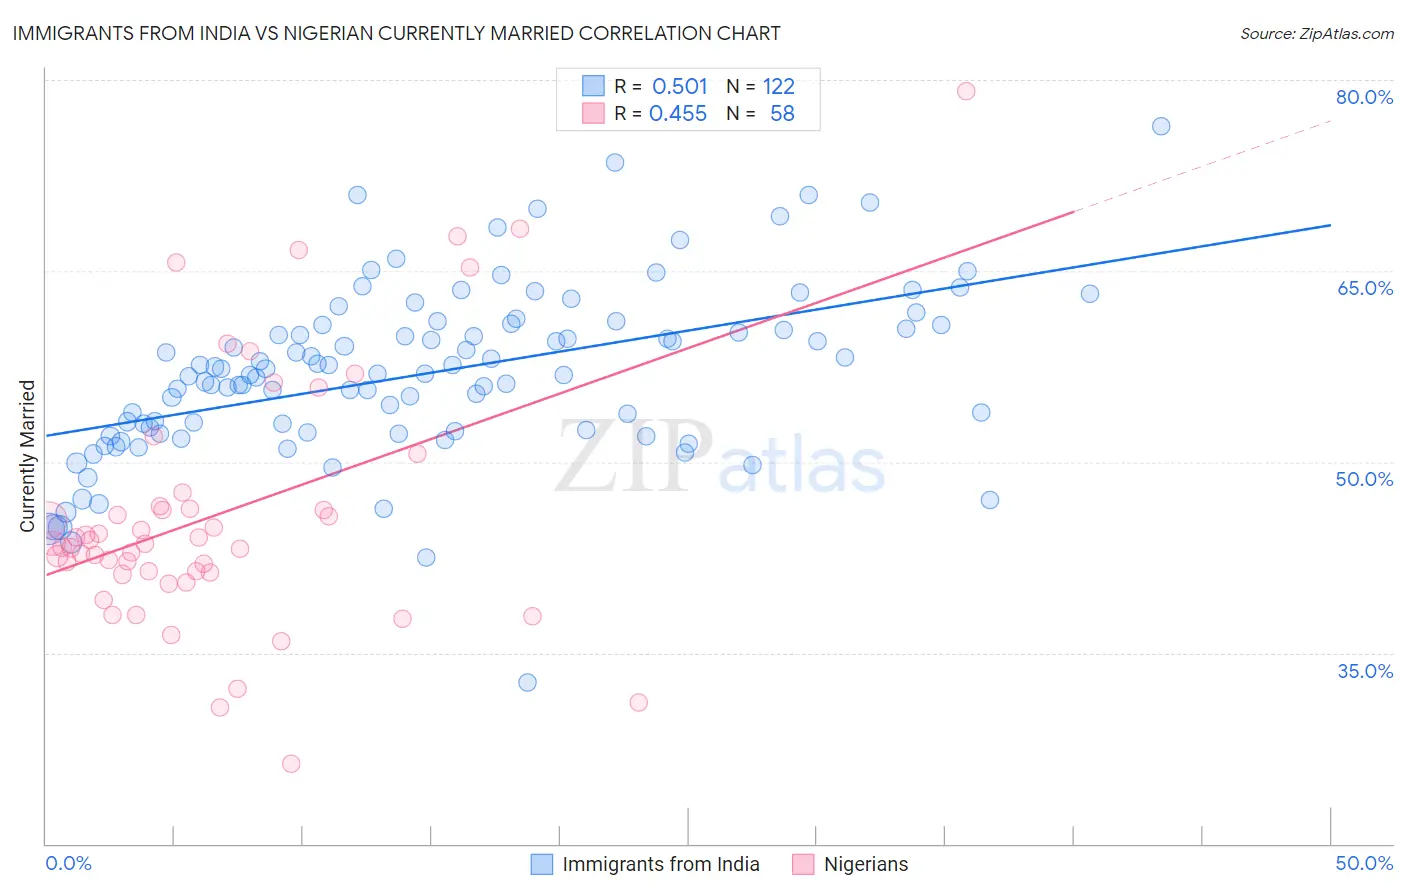
Immigrants from India vs Nigerian Currently Married Correlation Chart
The statistical analysis conducted on geographies consisting of 434,052,762 people shows a substantial positive correlation between the proportion of Immigrants from India and percentage of population currently married in the United States with a correlation coefficient (R) of 0.501 and weighted average of 51.8%. Similarly, the statistical analysis conducted on geographies consisting of 332,730,636 people shows a moderate positive correlation between the proportion of Nigerians and percentage of population currently married in the United States with a correlation coefficient (R) of 0.455 and weighted average of 43.4%, a difference of 19.1%.
Currently Married Correlation Summary
| Measurement | Immigrants from India | Nigerian |
| Minimum | 32.7% | 26.3% |
| Maximum | 76.4% | 79.1% |
| Range | 43.7% | 52.8% |
| Mean | 57.0% | 46.0% |
| Median | 56.9% | 43.6% |
| Interquartile 25% (IQ1) | 52.4% | 41.3% |
| Interquartile 75% (IQ3) | 60.7% | 46.5% |
| Interquartile Range (IQR) | 8.3% | 5.2% |
| Standard Deviation (Sample) | 6.8% | 10.1% |
| Standard Deviation (Population) | 6.8% | 10.0% |
Similar Demographics by Currently Married
Demographics Similar to Immigrants from India by Currently Married
In terms of currently married, the demographic groups most similar to Immigrants from India are Thai (50.9%, a difference of 1.8%), Assyrian/Chaldean/Syriac (50.8%, a difference of 1.9%), Immigrants from Taiwan (50.7%, a difference of 2.0%), Danish (50.5%, a difference of 2.6%), and Norwegian (50.2%, a difference of 3.1%).
| Demographics | Rating | Rank | Currently Married |
| Immigrants | India | 100.0 /100 | #1 | Exceptional 51.8% |
| Thais | 100.0 /100 | #2 | Exceptional 50.9% |
| Assyrians/Chaldeans/Syriacs | 100.0 /100 | #3 | Exceptional 50.8% |
| Immigrants | Taiwan | 100.0 /100 | #4 | Exceptional 50.7% |
| Danes | 100.0 /100 | #5 | Exceptional 50.5% |
| Norwegians | 100.0 /100 | #6 | Exceptional 50.2% |
| Immigrants | South Central Asia | 100.0 /100 | #7 | Exceptional 50.0% |
| Swedes | 100.0 /100 | #8 | Exceptional 50.0% |
| Czechs | 99.9 /100 | #9 | Exceptional 49.9% |
| Filipinos | 99.9 /100 | #10 | Exceptional 49.7% |
| English | 99.9 /100 | #11 | Exceptional 49.7% |
| Swiss | 99.9 /100 | #12 | Exceptional 49.7% |
| Dutch | 99.9 /100 | #13 | Exceptional 49.6% |
| Germans | 99.9 /100 | #14 | Exceptional 49.6% |
| Pennsylvania Germans | 99.9 /100 | #15 | Exceptional 49.6% |
Demographics Similar to Nigerians by Currently Married
In terms of currently married, the demographic groups most similar to Nigerians are Yaqui (43.4%, a difference of 0.020%), Colville (43.4%, a difference of 0.020%), Sierra Leonean (43.4%, a difference of 0.050%), Indonesian (43.5%, a difference of 0.060%), and Immigrants from Nigeria (43.4%, a difference of 0.060%).
| Demographics | Rating | Rank | Currently Married |
| Immigrants | Eritrea | 0.1 /100 | #267 | Tragic 43.6% |
| Spanish American Indians | 0.1 /100 | #268 | Tragic 43.6% |
| Immigrants | Sudan | 0.1 /100 | #269 | Tragic 43.5% |
| Salvadorans | 0.1 /100 | #270 | Tragic 43.5% |
| Bermudans | 0.1 /100 | #271 | Tragic 43.5% |
| Indonesians | 0.1 /100 | #272 | Tragic 43.5% |
| Yaqui | 0.1 /100 | #273 | Tragic 43.4% |
| Nigerians | 0.1 /100 | #274 | Tragic 43.4% |
| Colville | 0.1 /100 | #275 | Tragic 43.4% |
| Sierra Leoneans | 0.1 /100 | #276 | Tragic 43.4% |
| Immigrants | Nigeria | 0.1 /100 | #277 | Tragic 43.4% |
| Central Americans | 0.0 /100 | #278 | Tragic 43.3% |
| Central American Indians | 0.0 /100 | #279 | Tragic 43.3% |
| Apache | 0.0 /100 | #280 | Tragic 43.2% |
| Chippewa | 0.0 /100 | #281 | Tragic 43.2% |