Immigrants from India vs Albanian Single Father Households
COMPARE
Immigrants from India
Albanian
Single Father Households
Single Father Households Comparison
Immigrants from India
Albanians
1.9%
SINGLE FATHER HOUSEHOLDS
100.0/ 100
METRIC RATING
17th/ 347
METRIC RANK
2.0%
SINGLE FATHER HOUSEHOLDS
100.0/ 100
METRIC RATING
35th/ 347
METRIC RANK
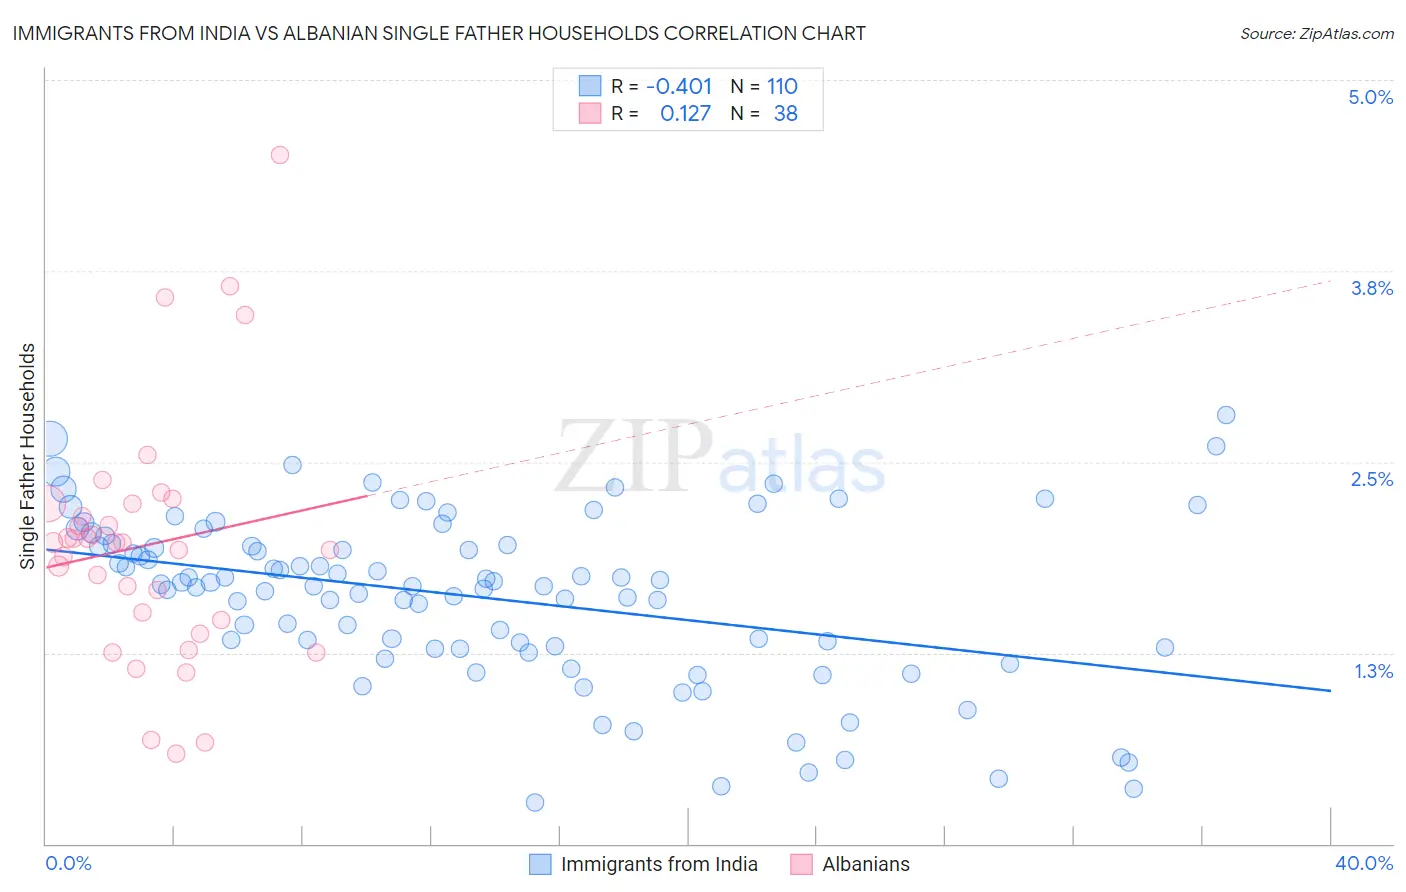
Immigrants from India vs Albanian Single Father Households Correlation Chart
The statistical analysis conducted on geographies consisting of 429,563,662 people shows a moderate negative correlation between the proportion of Immigrants from India and percentage of single father households in the United States with a correlation coefficient (R) of -0.401 and weighted average of 1.9%. Similarly, the statistical analysis conducted on geographies consisting of 192,201,260 people shows a poor positive correlation between the proportion of Albanians and percentage of single father households in the United States with a correlation coefficient (R) of 0.127 and weighted average of 2.0%, a difference of 4.6%.
Single Father Households Correlation Summary
| Measurement | Immigrants from India | Albanian |
| Minimum | 0.27% | 0.59% |
| Maximum | 2.8% | 4.5% |
| Range | 2.5% | 3.9% |
| Mean | 1.6% | 2.0% |
| Median | 1.7% | 2.0% |
| Interquartile 25% (IQ1) | 1.3% | 1.5% |
| Interquartile 75% (IQ3) | 2.0% | 2.2% |
| Interquartile Range (IQR) | 0.67% | 0.77% |
| Standard Deviation (Sample) | 0.55% | 0.81% |
| Standard Deviation (Population) | 0.54% | 0.80% |
Demographics Similar to Immigrants from India and Albanians by Single Father Households
In terms of single father households, the demographic groups most similar to Immigrants from India are Immigrants from Iran (1.9%, a difference of 0.23%), Indian (Asian) (1.9%, a difference of 0.50%), Iranian (1.9%, a difference of 1.3%), Thai (1.9%, a difference of 1.4%), and Immigrants from Albania (1.9%, a difference of 1.7%). Similarly, the demographic groups most similar to Albanians are Immigrants from Belgium (2.0%, a difference of 0.11%), Immigrants from Australia (2.0%, a difference of 0.32%), Turkish (2.0%, a difference of 0.34%), Chinese (2.0%, a difference of 0.55%), and Israeli (2.0%, a difference of 0.60%).
| Demographics | Rating | Rank | Single Father Households |
| Immigrants | Iran | 100.0 /100 | #16 | Exceptional 1.9% |
| Immigrants | India | 100.0 /100 | #17 | Exceptional 1.9% |
| Indians (Asian) | 100.0 /100 | #18 | Exceptional 1.9% |
| Iranians | 100.0 /100 | #19 | Exceptional 1.9% |
| Thais | 100.0 /100 | #20 | Exceptional 1.9% |
| Immigrants | Albania | 100.0 /100 | #21 | Exceptional 1.9% |
| Immigrants | Latvia | 100.0 /100 | #22 | Exceptional 1.9% |
| Immigrants | Croatia | 100.0 /100 | #23 | Exceptional 2.0% |
| Immigrants | Russia | 100.0 /100 | #24 | Exceptional 2.0% |
| Eastern Europeans | 100.0 /100 | #25 | Exceptional 2.0% |
| Assyrians/Chaldeans/Syriacs | 100.0 /100 | #26 | Exceptional 2.0% |
| Immigrants | South Central Asia | 100.0 /100 | #27 | Exceptional 2.0% |
| Immigrants | Japan | 100.0 /100 | #28 | Exceptional 2.0% |
| Bulgarians | 100.0 /100 | #29 | Exceptional 2.0% |
| Cambodians | 100.0 /100 | #30 | Exceptional 2.0% |
| Israelis | 100.0 /100 | #31 | Exceptional 2.0% |
| Chinese | 100.0 /100 | #32 | Exceptional 2.0% |
| Turks | 100.0 /100 | #33 | Exceptional 2.0% |
| Immigrants | Australia | 100.0 /100 | #34 | Exceptional 2.0% |
| Albanians | 100.0 /100 | #35 | Exceptional 2.0% |
| Immigrants | Belgium | 100.0 /100 | #36 | Exceptional 2.0% |