Immigrants from Hungary vs Spanish American Indian Currently Married
COMPARE
Immigrants from Hungary
Spanish American Indian
Currently Married
Currently Married Comparison
Immigrants from Hungary
Spanish American Indians
47.6%
CURRENTLY MARRIED
91.2/ 100
METRIC RATING
111th/ 347
METRIC RANK
43.6%
CURRENTLY MARRIED
0.1/ 100
METRIC RATING
268th/ 347
METRIC RANK
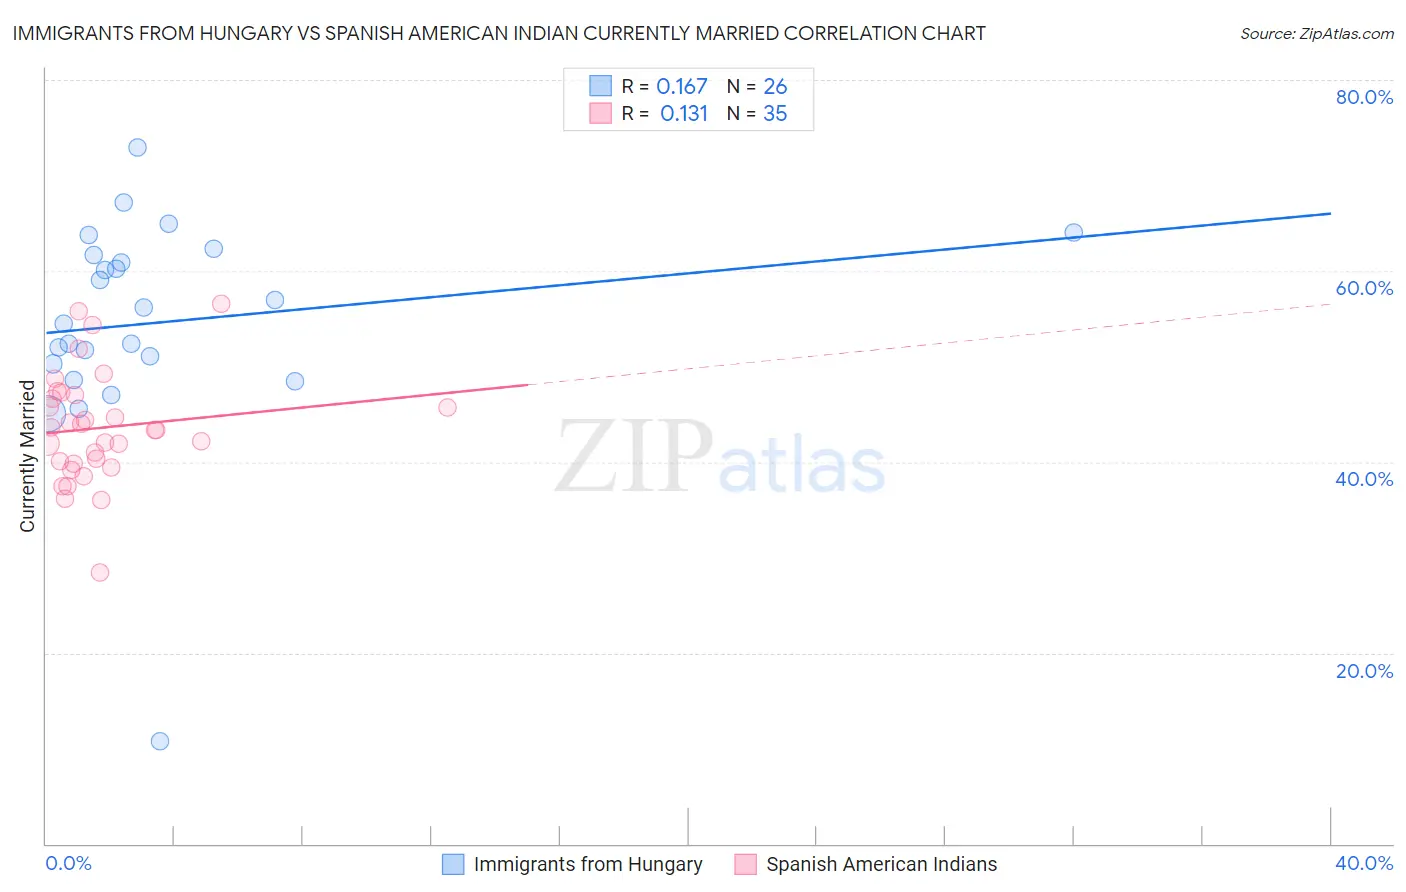
Immigrants from Hungary vs Spanish American Indian Currently Married Correlation Chart
The statistical analysis conducted on geographies consisting of 195,704,410 people shows a poor positive correlation between the proportion of Immigrants from Hungary and percentage of population currently married in the United States with a correlation coefficient (R) of 0.167 and weighted average of 47.6%. Similarly, the statistical analysis conducted on geographies consisting of 73,150,359 people shows a poor positive correlation between the proportion of Spanish American Indians and percentage of population currently married in the United States with a correlation coefficient (R) of 0.131 and weighted average of 43.6%, a difference of 9.3%.
Currently Married Correlation Summary
| Measurement | Immigrants from Hungary | Spanish American Indian |
| Minimum | 10.7% | 28.4% |
| Maximum | 72.9% | 56.6% |
| Range | 62.2% | 28.2% |
| Mean | 54.6% | 43.6% |
| Median | 55.3% | 43.4% |
| Interquartile 25% (IQ1) | 50.3% | 39.8% |
| Interquartile 75% (IQ3) | 61.7% | 47.0% |
| Interquartile Range (IQR) | 11.4% | 7.2% |
| Standard Deviation (Sample) | 11.5% | 5.8% |
| Standard Deviation (Population) | 11.3% | 5.7% |
Similar Demographics by Currently Married
Demographics Similar to Immigrants from Hungary by Currently Married
In terms of currently married, the demographic groups most similar to Immigrants from Hungary are Immigrants from Western Europe (47.6%, a difference of 0.010%), Immigrants from Denmark (47.6%, a difference of 0.040%), South African (47.6%, a difference of 0.070%), Immigrants from Indonesia (47.6%, a difference of 0.070%), and Palestinian (47.6%, a difference of 0.080%).
| Demographics | Rating | Rank | Currently Married |
| Serbians | 93.6 /100 | #104 | Exceptional 47.8% |
| Immigrants | Singapore | 93.3 /100 | #105 | Exceptional 47.8% |
| Immigrants | Greece | 93.1 /100 | #106 | Exceptional 47.7% |
| Immigrants | Italy | 92.9 /100 | #107 | Exceptional 47.7% |
| Tsimshian | 92.4 /100 | #108 | Exceptional 47.7% |
| Immigrants | Egypt | 92.3 /100 | #109 | Exceptional 47.7% |
| Immigrants | Russia | 92.0 /100 | #110 | Exceptional 47.7% |
| Immigrants | Hungary | 91.2 /100 | #111 | Exceptional 47.6% |
| Immigrants | Western Europe | 91.1 /100 | #112 | Exceptional 47.6% |
| Immigrants | Denmark | 90.9 /100 | #113 | Exceptional 47.6% |
| South Africans | 90.5 /100 | #114 | Exceptional 47.6% |
| Immigrants | Indonesia | 90.5 /100 | #115 | Exceptional 47.6% |
| Palestinians | 90.4 /100 | #116 | Exceptional 47.6% |
| Puget Sound Salish | 90.3 /100 | #117 | Exceptional 47.6% |
| Immigrants | Philippines | 90.2 /100 | #118 | Exceptional 47.6% |
Demographics Similar to Spanish American Indians by Currently Married
In terms of currently married, the demographic groups most similar to Spanish American Indians are Immigrants from Eritrea (43.6%, a difference of 0.0%), Ecuadorian (43.6%, a difference of 0.030%), Immigrants from Bangladesh (43.6%, a difference of 0.10%), Immigrants from Sudan (43.5%, a difference of 0.12%), and Sudanese (43.7%, a difference of 0.18%).
| Demographics | Rating | Rank | Currently Married |
| Immigrants | Nicaragua | 0.1 /100 | #261 | Tragic 43.7% |
| Bangladeshis | 0.1 /100 | #262 | Tragic 43.7% |
| Immigrants | Cuba | 0.1 /100 | #263 | Tragic 43.7% |
| Sudanese | 0.1 /100 | #264 | Tragic 43.7% |
| Immigrants | Bangladesh | 0.1 /100 | #265 | Tragic 43.6% |
| Ecuadorians | 0.1 /100 | #266 | Tragic 43.6% |
| Immigrants | Eritrea | 0.1 /100 | #267 | Tragic 43.6% |
| Spanish American Indians | 0.1 /100 | #268 | Tragic 43.6% |
| Immigrants | Sudan | 0.1 /100 | #269 | Tragic 43.5% |
| Salvadorans | 0.1 /100 | #270 | Tragic 43.5% |
| Bermudans | 0.1 /100 | #271 | Tragic 43.5% |
| Indonesians | 0.1 /100 | #272 | Tragic 43.5% |
| Yaqui | 0.1 /100 | #273 | Tragic 43.4% |
| Nigerians | 0.1 /100 | #274 | Tragic 43.4% |
| Colville | 0.1 /100 | #275 | Tragic 43.4% |