Immigrants from Hungary vs Somali Divorced or Separated
COMPARE
Immigrants from Hungary
Somali
Divorced or Separated
Divorced or Separated Comparison
Immigrants from Hungary
Somalis
11.9%
DIVORCED OR SEPARATED
73.7/ 100
METRIC RATING
152nd/ 347
METRIC RANK
12.6%
DIVORCED OR SEPARATED
0.9/ 100
METRIC RATING
253rd/ 347
METRIC RANK
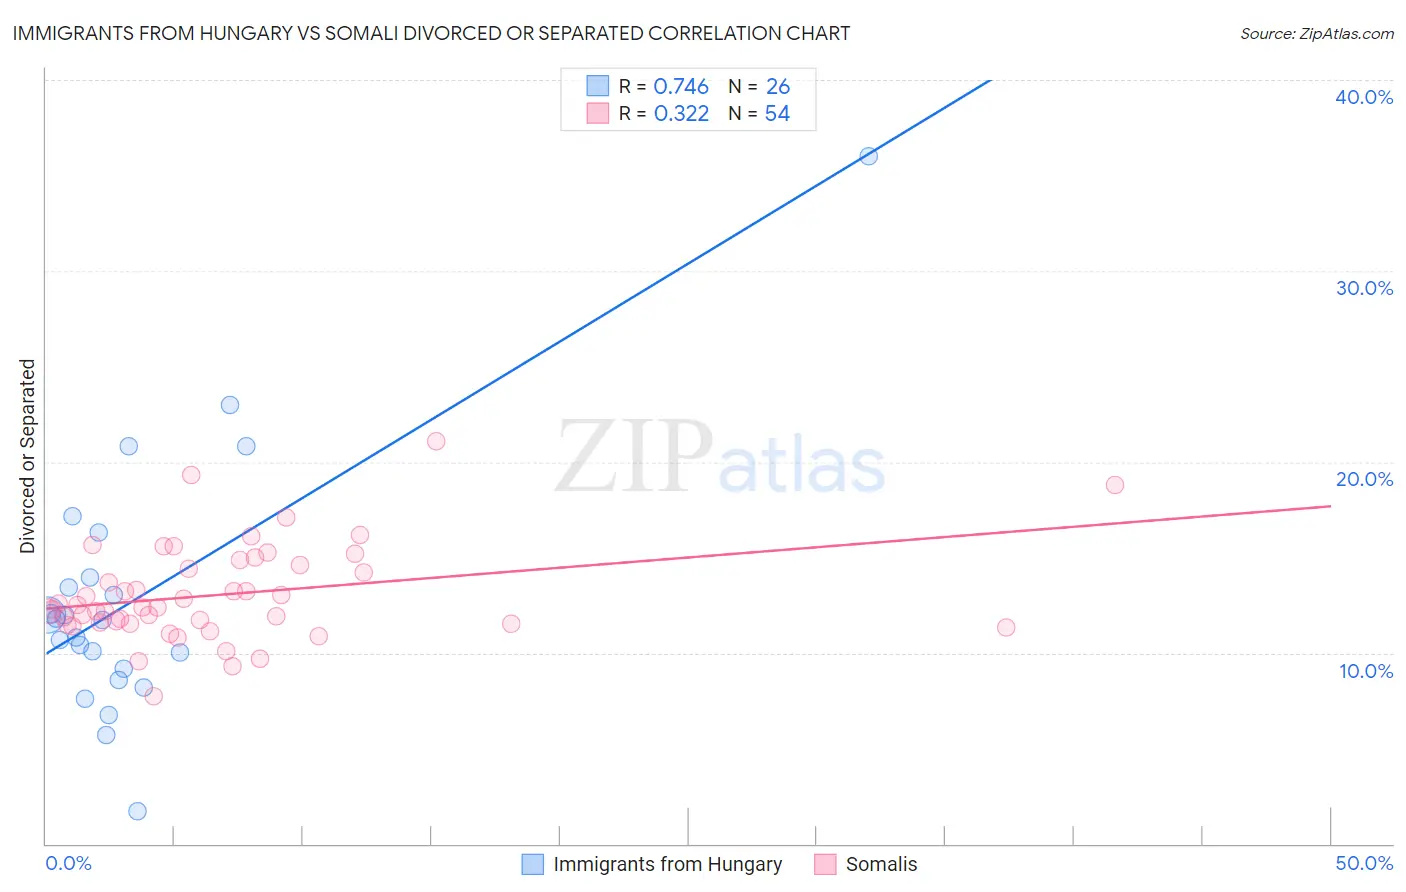
Immigrants from Hungary vs Somali Divorced or Separated Correlation Chart
The statistical analysis conducted on geographies consisting of 195,671,532 people shows a strong positive correlation between the proportion of Immigrants from Hungary and percentage of population currently divorced or separated in the United States with a correlation coefficient (R) of 0.746 and weighted average of 11.9%. Similarly, the statistical analysis conducted on geographies consisting of 99,313,071 people shows a mild positive correlation between the proportion of Somalis and percentage of population currently divorced or separated in the United States with a correlation coefficient (R) of 0.322 and weighted average of 12.6%, a difference of 5.1%.
Divorced or Separated Correlation Summary
| Measurement | Immigrants from Hungary | Somali |
| Minimum | 1.7% | 7.7% |
| Maximum | 36.0% | 21.1% |
| Range | 34.3% | 13.4% |
| Mean | 12.8% | 13.0% |
| Median | 11.8% | 12.4% |
| Interquartile 25% (IQ1) | 9.2% | 11.5% |
| Interquartile 75% (IQ3) | 13.9% | 14.6% |
| Interquartile Range (IQR) | 4.7% | 3.1% |
| Standard Deviation (Sample) | 6.7% | 2.5% |
| Standard Deviation (Population) | 6.6% | 2.5% |
Similar Demographics by Divorced or Separated
Demographics Similar to Immigrants from Hungary by Divorced or Separated
In terms of divorced or separated, the demographic groups most similar to Immigrants from Hungary are Austrian (12.0%, a difference of 0.070%), Chilean (12.0%, a difference of 0.10%), Japanese (12.0%, a difference of 0.12%), Czech (11.9%, a difference of 0.13%), and Hungarian (12.0%, a difference of 0.15%).
| Demographics | Rating | Rank | Divorced or Separated |
| Croatians | 80.6 /100 | #145 | Excellent 11.9% |
| Immigrants | Grenada | 79.1 /100 | #146 | Good 11.9% |
| Poles | 78.6 /100 | #147 | Good 11.9% |
| Italians | 77.8 /100 | #148 | Good 11.9% |
| Immigrants | Oceania | 77.7 /100 | #149 | Good 11.9% |
| Immigrants | Portugal | 77.3 /100 | #150 | Good 11.9% |
| Czechs | 76.4 /100 | #151 | Good 11.9% |
| Immigrants | Hungary | 73.7 /100 | #152 | Good 11.9% |
| Austrians | 72.2 /100 | #153 | Good 12.0% |
| Chileans | 71.3 /100 | #154 | Good 12.0% |
| Japanese | 70.9 /100 | #155 | Good 12.0% |
| Hungarians | 70.3 /100 | #156 | Good 12.0% |
| Immigrants | Brazil | 68.8 /100 | #157 | Good 12.0% |
| Icelanders | 66.0 /100 | #158 | Good 12.0% |
| Immigrants | Barbados | 66.0 /100 | #159 | Good 12.0% |
Demographics Similar to Somalis by Divorced or Separated
In terms of divorced or separated, the demographic groups most similar to Somalis are Liberian (12.6%, a difference of 0.0%), Senegalese (12.6%, a difference of 0.060%), Welsh (12.6%, a difference of 0.16%), Immigrants from Colombia (12.6%, a difference of 0.31%), and Irish (12.5%, a difference of 0.33%).
| Demographics | Rating | Rank | Divorced or Separated |
| Immigrants | West Indies | 1.9 /100 | #246 | Tragic 12.5% |
| Germans | 1.8 /100 | #247 | Tragic 12.5% |
| Nepalese | 1.8 /100 | #248 | Tragic 12.5% |
| Finns | 1.8 /100 | #249 | Tragic 12.5% |
| Irish | 1.3 /100 | #250 | Tragic 12.5% |
| Aleuts | 1.3 /100 | #251 | Tragic 12.5% |
| Liberians | 0.9 /100 | #252 | Tragic 12.6% |
| Somalis | 0.9 /100 | #253 | Tragic 12.6% |
| Senegalese | 0.8 /100 | #254 | Tragic 12.6% |
| Welsh | 0.7 /100 | #255 | Tragic 12.6% |
| Immigrants | Colombia | 0.6 /100 | #256 | Tragic 12.6% |
| Immigrants | Somalia | 0.6 /100 | #257 | Tragic 12.6% |
| Indonesians | 0.6 /100 | #258 | Tragic 12.6% |
| Yuman | 0.6 /100 | #259 | Tragic 12.6% |
| Immigrants | Uruguay | 0.6 /100 | #260 | Tragic 12.6% |