Immigrants from Hungary vs Japanese Average Family Size
COMPARE
Immigrants from Hungary
Japanese
Average Family Size
Average Family Size Comparison
Immigrants from Hungary
Japanese
3.17
AVERAGE FAMILY SIZE
1.7/ 100
METRIC RATING
254th/ 347
METRIC RANK
3.35
AVERAGE FAMILY SIZE
100.0/ 100
METRIC RATING
59th/ 347
METRIC RANK
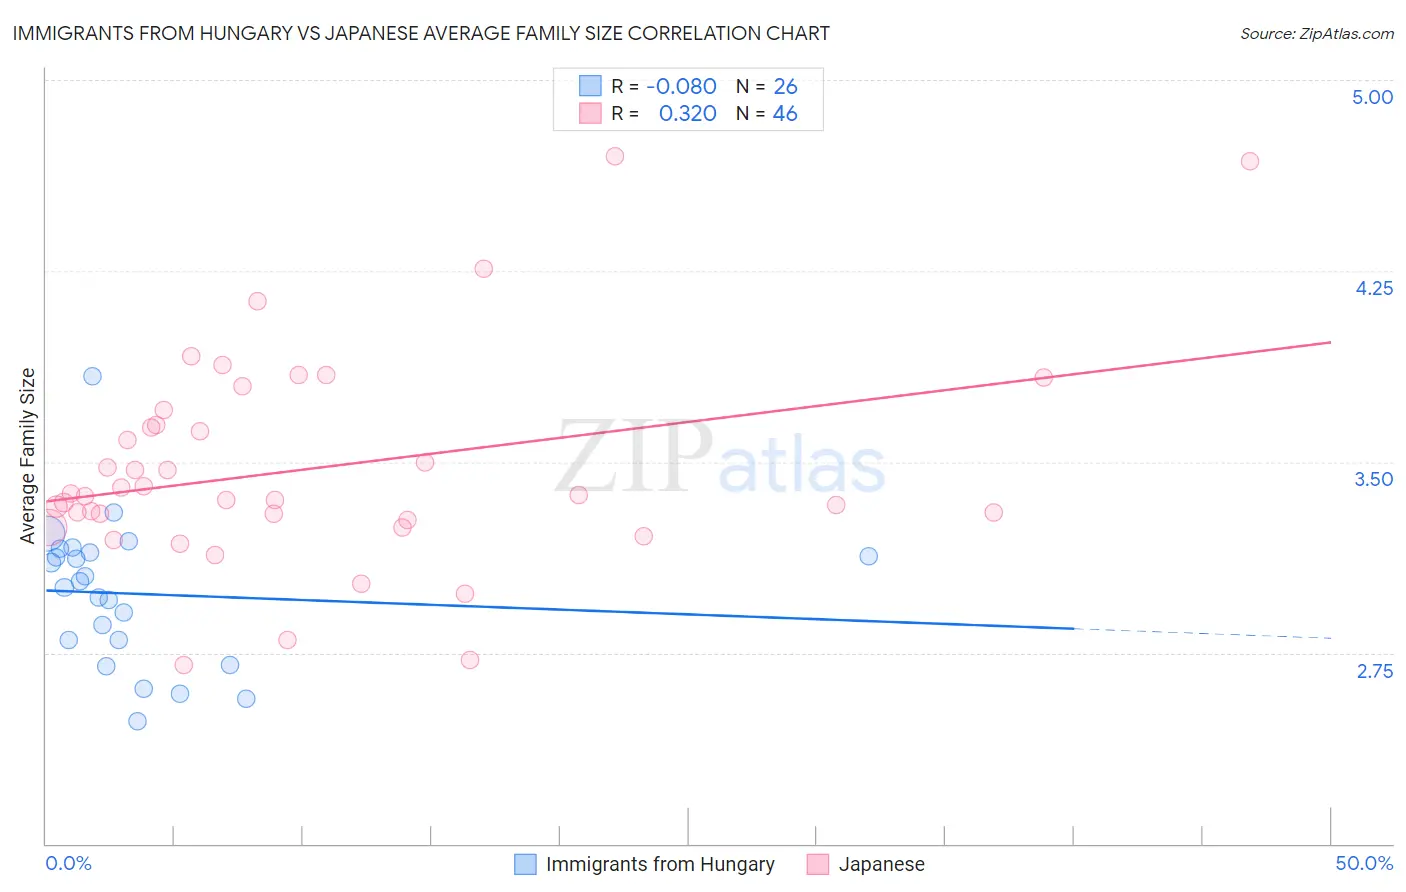
Immigrants from Hungary vs Japanese Average Family Size Correlation Chart
The statistical analysis conducted on geographies consisting of 195,664,672 people shows a slight negative correlation between the proportion of Immigrants from Hungary and average family size in the United States with a correlation coefficient (R) of -0.080 and weighted average of 3.17. Similarly, the statistical analysis conducted on geographies consisting of 249,073,483 people shows a mild positive correlation between the proportion of Japanese and average family size in the United States with a correlation coefficient (R) of 0.320 and weighted average of 3.35, a difference of 5.7%.
Average Family Size Correlation Summary
| Measurement | Immigrants from Hungary | Japanese |
| Minimum | 2.48 | 2.70 |
| Maximum | 3.84 | 4.70 |
| Range | 1.36 | 2.00 |
| Mean | 2.98 | 3.47 |
| Median | 3.02 | 3.37 |
| Interquartile 25% (IQ1) | 2.80 | 3.27 |
| Interquartile 75% (IQ3) | 3.15 | 3.65 |
| Interquartile Range (IQR) | 0.35 | 0.38 |
| Standard Deviation (Sample) | 0.29 | 0.42 |
| Standard Deviation (Population) | 0.28 | 0.41 |
Similar Demographics by Average Family Size
Demographics Similar to Immigrants from Hungary by Average Family Size
In terms of average family size, the demographic groups most similar to Immigrants from Hungary are Immigrants from Saudi Arabia (3.17, a difference of 0.0%), South African (3.17, a difference of 0.0%), Cape Verdean (3.17, a difference of 0.010%), Immigrants from Spain (3.17, a difference of 0.040%), and Immigrants from Kazakhstan (3.17, a difference of 0.040%).
| Demographics | Rating | Rank | Average Family Size |
| Cajuns | 2.4 /100 | #247 | Tragic 3.17 |
| Immigrants | Belarus | 2.3 /100 | #248 | Tragic 3.17 |
| Immigrants | Eastern Europe | 2.1 /100 | #249 | Tragic 3.17 |
| Puget Sound Salish | 1.9 /100 | #250 | Tragic 3.17 |
| Immigrants | Spain | 1.8 /100 | #251 | Tragic 3.17 |
| Immigrants | Saudi Arabia | 1.7 /100 | #252 | Tragic 3.17 |
| South Africans | 1.7 /100 | #253 | Tragic 3.17 |
| Immigrants | Hungary | 1.7 /100 | #254 | Tragic 3.17 |
| Cape Verdeans | 1.6 /100 | #255 | Tragic 3.17 |
| Immigrants | Kazakhstan | 1.5 /100 | #256 | Tragic 3.17 |
| Albanians | 1.5 /100 | #257 | Tragic 3.17 |
| Turks | 1.3 /100 | #258 | Tragic 3.16 |
| Potawatomi | 1.3 /100 | #259 | Tragic 3.16 |
| Immigrants | Albania | 1.3 /100 | #260 | Tragic 3.16 |
| Immigrants | North Macedonia | 1.3 /100 | #261 | Tragic 3.16 |
Demographics Similar to Japanese by Average Family Size
In terms of average family size, the demographic groups most similar to Japanese are Immigrants from Armenia (3.35, a difference of 0.020%), Central American Indian (3.35, a difference of 0.050%), Honduran (3.35, a difference of 0.090%), Sri Lankan (3.35, a difference of 0.10%), and Immigrants from Dominican Republic (3.35, a difference of 0.15%).
| Demographics | Rating | Rank | Average Family Size |
| Fijians | 100.0 /100 | #52 | Exceptional 3.36 |
| Koreans | 100.0 /100 | #53 | Exceptional 3.36 |
| Immigrants | South Eastern Asia | 100.0 /100 | #54 | Exceptional 3.36 |
| Immigrants | Honduras | 100.0 /100 | #55 | Exceptional 3.36 |
| Immigrants | Dominican Republic | 100.0 /100 | #56 | Exceptional 3.35 |
| Sri Lankans | 100.0 /100 | #57 | Exceptional 3.35 |
| Hondurans | 100.0 /100 | #58 | Exceptional 3.35 |
| Japanese | 100.0 /100 | #59 | Exceptional 3.35 |
| Immigrants | Armenia | 100.0 /100 | #60 | Exceptional 3.35 |
| Central American Indians | 100.0 /100 | #61 | Exceptional 3.35 |
| Immigrants | Grenada | 100.0 /100 | #62 | Exceptional 3.34 |
| Chinese | 100.0 /100 | #63 | Exceptional 3.34 |
| Dominicans | 99.9 /100 | #64 | Exceptional 3.34 |
| Immigrants | Laos | 99.9 /100 | #65 | Exceptional 3.34 |
| Immigrants | St. Vincent and the Grenadines | 99.9 /100 | #66 | Exceptional 3.34 |