Immigrants from Hungary vs Immigrants from Israel Single Mother Households
COMPARE
Immigrants from Hungary
Immigrants from Israel
Single Mother Households
Single Mother Households Comparison
Immigrants from Hungary
Immigrants from Israel
5.7%
SINGLE MOTHER HOUSEHOLDS
97.8/ 100
METRIC RATING
83rd/ 347
METRIC RANK
5.0%
SINGLE MOTHER HOUSEHOLDS
99.9/ 100
METRIC RATING
10th/ 347
METRIC RANK
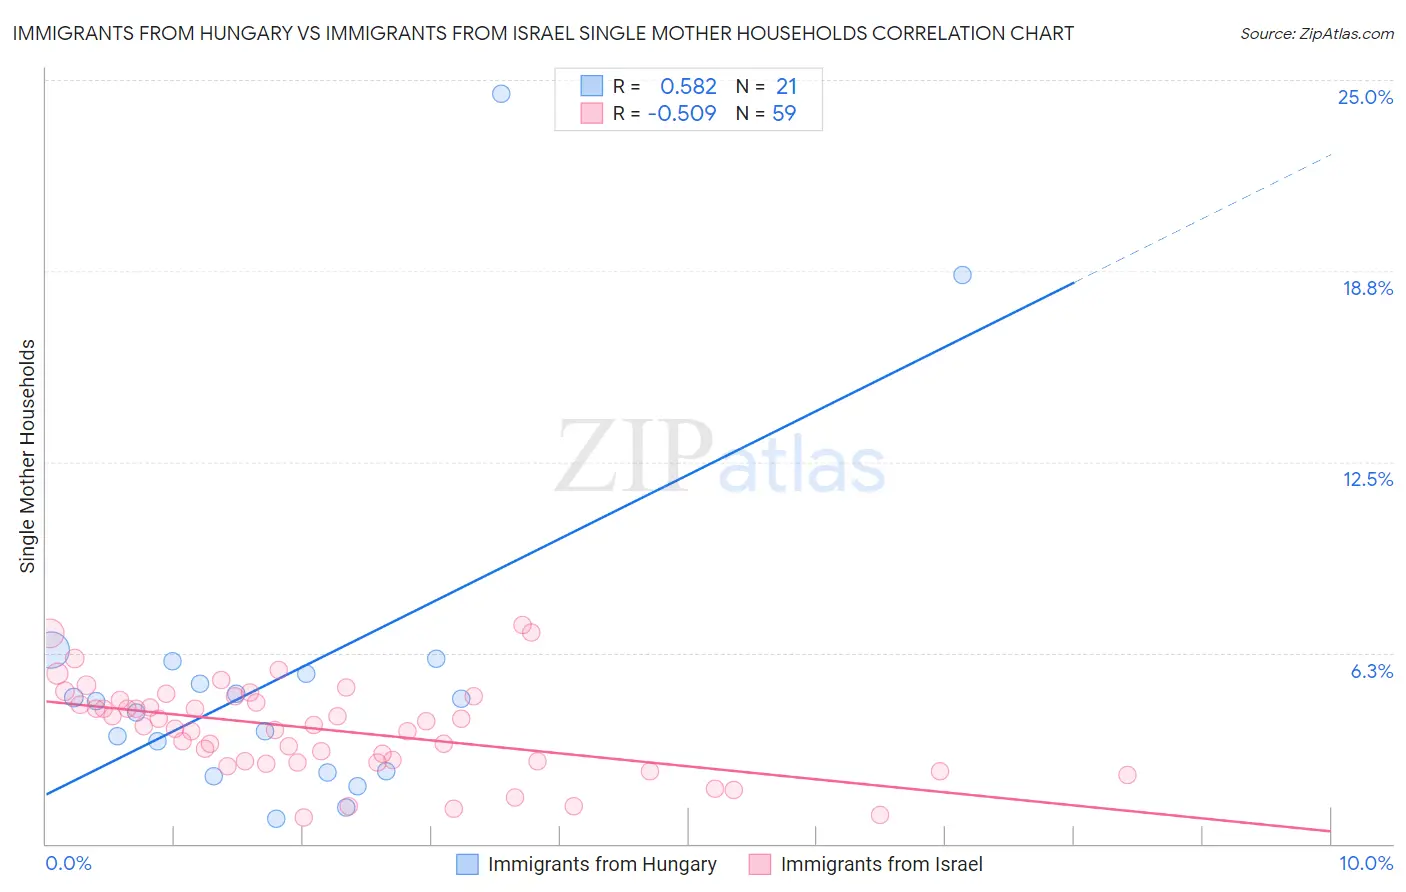
Immigrants from Hungary vs Immigrants from Israel Single Mother Households Correlation Chart
The statistical analysis conducted on geographies consisting of 195,293,464 people shows a substantial positive correlation between the proportion of Immigrants from Hungary and percentage of single mother households in the United States with a correlation coefficient (R) of 0.582 and weighted average of 5.7%. Similarly, the statistical analysis conducted on geographies consisting of 209,589,874 people shows a substantial negative correlation between the proportion of Immigrants from Israel and percentage of single mother households in the United States with a correlation coefficient (R) of -0.509 and weighted average of 5.0%, a difference of 12.6%.
Single Mother Households Correlation Summary
| Measurement | Immigrants from Hungary | Immigrants from Israel |
| Minimum | 0.83% | 0.87% |
| Maximum | 24.6% | 7.1% |
| Range | 23.7% | 6.3% |
| Mean | 5.6% | 3.7% |
| Median | 4.7% | 3.9% |
| Interquartile 25% (IQ1) | 2.4% | 2.7% |
| Interquartile 75% (IQ3) | 5.8% | 4.7% |
| Interquartile Range (IQR) | 3.4% | 2.0% |
| Standard Deviation (Sample) | 5.6% | 1.5% |
| Standard Deviation (Population) | 5.5% | 1.5% |
Similar Demographics by Single Mother Households
Demographics Similar to Immigrants from Hungary by Single Mother Households
In terms of single mother households, the demographic groups most similar to Immigrants from Hungary are Immigrants from Malaysia (5.7%, a difference of 0.030%), Carpatho Rusyn (5.7%, a difference of 0.080%), Hungarian (5.7%, a difference of 0.23%), Czech (5.6%, a difference of 0.24%), and Immigrants from Moldova (5.6%, a difference of 0.24%).
| Demographics | Rating | Rank | Single Mother Households |
| New Zealanders | 98.2 /100 | #76 | Exceptional 5.6% |
| Romanians | 98.1 /100 | #77 | Exceptional 5.6% |
| Swiss | 98.1 /100 | #78 | Exceptional 5.6% |
| Immigrants | Sri Lanka | 98.0 /100 | #79 | Exceptional 5.6% |
| Czechs | 97.9 /100 | #80 | Exceptional 5.6% |
| Immigrants | Moldova | 97.9 /100 | #81 | Exceptional 5.6% |
| Immigrants | Malaysia | 97.8 /100 | #82 | Exceptional 5.7% |
| Immigrants | Hungary | 97.8 /100 | #83 | Exceptional 5.7% |
| Carpatho Rusyns | 97.7 /100 | #84 | Exceptional 5.7% |
| Hungarians | 97.6 /100 | #85 | Exceptional 5.7% |
| Finns | 97.6 /100 | #86 | Exceptional 5.7% |
| Immigrants | Turkey | 97.5 /100 | #87 | Exceptional 5.7% |
| Israelis | 97.4 /100 | #88 | Exceptional 5.7% |
| Ukrainians | 97.2 /100 | #89 | Exceptional 5.7% |
| Immigrants | Indonesia | 97.2 /100 | #90 | Exceptional 5.7% |
Demographics Similar to Immigrants from Israel by Single Mother Households
In terms of single mother households, the demographic groups most similar to Immigrants from Israel are Okinawan (5.0%, a difference of 0.34%), Immigrants from Ireland (5.0%, a difference of 0.49%), Immigrants from China (5.1%, a difference of 0.63%), Cypriot (5.1%, a difference of 0.81%), and Immigrants from India (5.1%, a difference of 0.94%).
| Demographics | Rating | Rank | Single Mother Households |
| Immigrants | Iran | 100.0 /100 | #3 | Exceptional 4.8% |
| Assyrians/Chaldeans/Syriacs | 100.0 /100 | #4 | Exceptional 4.8% |
| Immigrants | Hong Kong | 100.0 /100 | #5 | Exceptional 4.8% |
| Immigrants | Singapore | 100.0 /100 | #6 | Exceptional 5.0% |
| Iranians | 100.0 /100 | #7 | Exceptional 5.0% |
| Immigrants | Ireland | 99.9 /100 | #8 | Exceptional 5.0% |
| Okinawans | 99.9 /100 | #9 | Exceptional 5.0% |
| Immigrants | Israel | 99.9 /100 | #10 | Exceptional 5.0% |
| Immigrants | China | 99.9 /100 | #11 | Exceptional 5.1% |
| Cypriots | 99.9 /100 | #12 | Exceptional 5.1% |
| Immigrants | India | 99.9 /100 | #13 | Exceptional 5.1% |
| Immigrants | Australia | 99.9 /100 | #14 | Exceptional 5.1% |
| Immigrants | Eastern Asia | 99.9 /100 | #15 | Exceptional 5.1% |
| Indians (Asian) | 99.9 /100 | #16 | Exceptional 5.1% |
| Soviet Union | 99.9 /100 | #17 | Exceptional 5.1% |