Immigrants from Hong Kong vs Swiss Divorced or Separated
COMPARE
Immigrants from Hong Kong
Swiss
Divorced or Separated
Divorced or Separated Comparison
Immigrants from Hong Kong
Swiss
10.0%
DIVORCED OR SEPARATED
100.0/ 100
METRIC RATING
3rd/ 347
METRIC RANK
12.0%
DIVORCED OR SEPARATED
63.6/ 100
METRIC RATING
164th/ 347
METRIC RANK
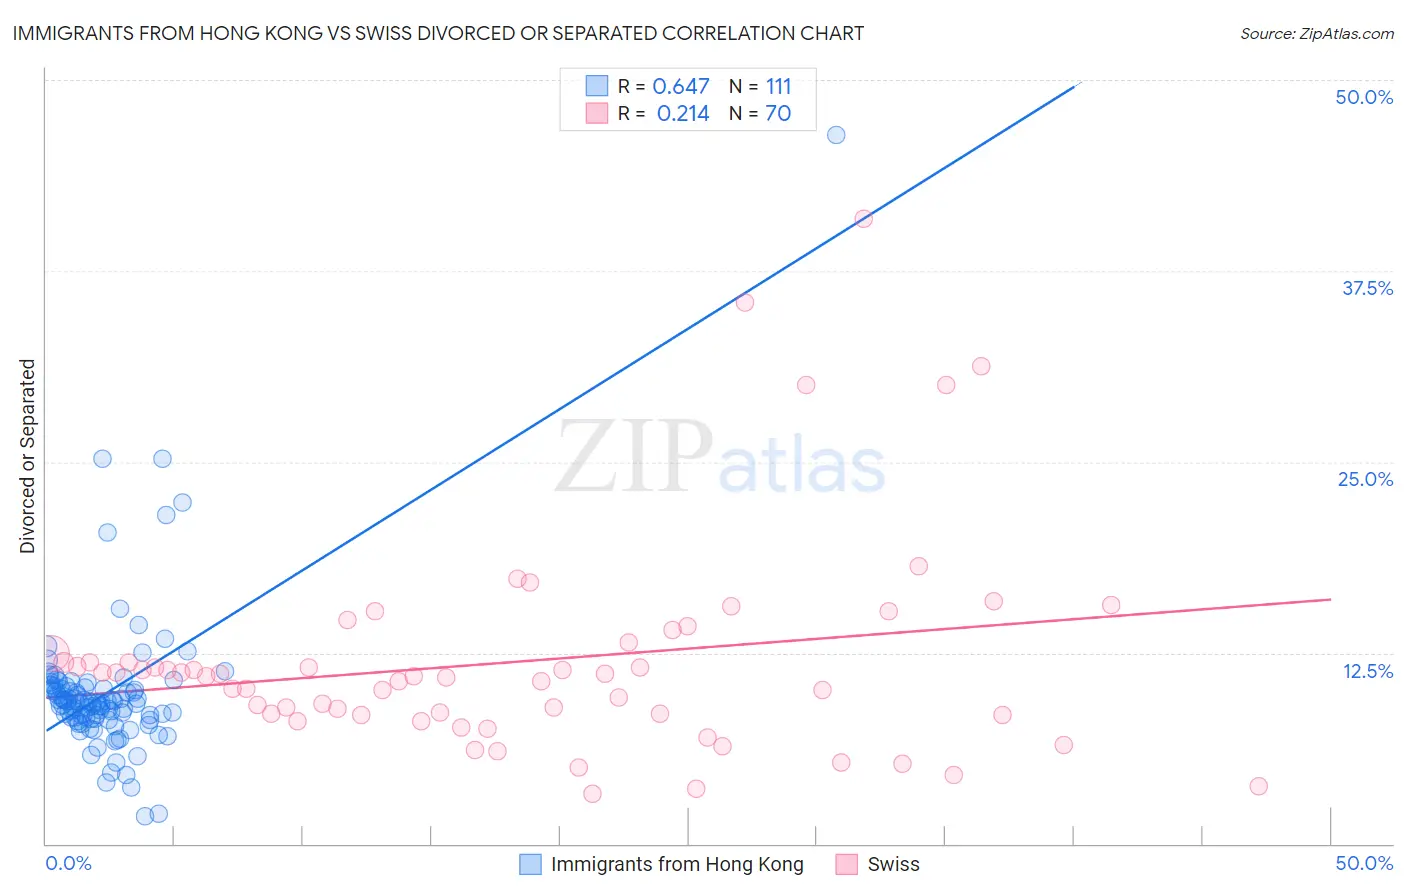
Immigrants from Hong Kong vs Swiss Divorced or Separated Correlation Chart
The statistical analysis conducted on geographies consisting of 253,935,113 people shows a significant positive correlation between the proportion of Immigrants from Hong Kong and percentage of population currently divorced or separated in the United States with a correlation coefficient (R) of 0.647 and weighted average of 10.0%. Similarly, the statistical analysis conducted on geographies consisting of 464,828,209 people shows a weak positive correlation between the proportion of Swiss and percentage of population currently divorced or separated in the United States with a correlation coefficient (R) of 0.214 and weighted average of 12.0%, a difference of 20.4%.
Divorced or Separated Correlation Summary
| Measurement | Immigrants from Hong Kong | Swiss |
| Minimum | 1.8% | 3.3% |
| Maximum | 46.4% | 40.9% |
| Range | 44.6% | 37.6% |
| Mean | 9.9% | 11.9% |
| Median | 9.2% | 11.0% |
| Interquartile 25% (IQ1) | 8.2% | 8.5% |
| Interquartile 75% (IQ3) | 10.2% | 12.4% |
| Interquartile Range (IQR) | 2.0% | 4.0% |
| Standard Deviation (Sample) | 5.0% | 7.0% |
| Standard Deviation (Population) | 5.0% | 6.9% |
Similar Demographics by Divorced or Separated
Demographics Similar to Immigrants from Hong Kong by Divorced or Separated
In terms of divorced or separated, the demographic groups most similar to Immigrants from Hong Kong are Filipino (9.9%, a difference of 0.56%), Immigrants from China (10.0%, a difference of 0.72%), Immigrants from India (10.1%, a difference of 0.96%), Immigrants from Taiwan (9.8%, a difference of 1.6%), and Indian (Asian) (10.2%, a difference of 2.3%).
| Demographics | Rating | Rank | Divorced or Separated |
| Immigrants | Taiwan | 100.0 /100 | #1 | Exceptional 9.8% |
| Filipinos | 100.0 /100 | #2 | Exceptional 9.9% |
| Immigrants | Hong Kong | 100.0 /100 | #3 | Exceptional 10.0% |
| Immigrants | China | 100.0 /100 | #4 | Exceptional 10.0% |
| Immigrants | India | 100.0 /100 | #5 | Exceptional 10.1% |
| Indians (Asian) | 100.0 /100 | #6 | Exceptional 10.2% |
| Thais | 100.0 /100 | #7 | Exceptional 10.2% |
| Immigrants | Eastern Asia | 100.0 /100 | #8 | Exceptional 10.2% |
| Yup'ik | 100.0 /100 | #9 | Exceptional 10.3% |
| Immigrants | Singapore | 100.0 /100 | #10 | Exceptional 10.3% |
| Immigrants | South Central Asia | 100.0 /100 | #11 | Exceptional 10.4% |
| Okinawans | 100.0 /100 | #12 | Exceptional 10.5% |
| Cypriots | 100.0 /100 | #13 | Exceptional 10.5% |
| Assyrians/Chaldeans/Syriacs | 100.0 /100 | #14 | Exceptional 10.6% |
| Immigrants | Armenia | 100.0 /100 | #15 | Exceptional 10.6% |
Demographics Similar to Swiss by Divorced or Separated
In terms of divorced or separated, the demographic groups most similar to Swiss are Navajo (12.0%, a difference of 0.010%), Samoan (12.0%, a difference of 0.020%), Marshallese (12.0%, a difference of 0.040%), German Russian (12.0%, a difference of 0.070%), and Immigrants from Scotland (12.0%, a difference of 0.080%).
| Demographics | Rating | Rank | Divorced or Separated |
| Immigrants | Brazil | 68.8 /100 | #157 | Good 12.0% |
| Icelanders | 66.0 /100 | #158 | Good 12.0% |
| Immigrants | Barbados | 66.0 /100 | #159 | Good 12.0% |
| Immigrants | Scotland | 65.8 /100 | #160 | Good 12.0% |
| Marshallese | 64.6 /100 | #161 | Good 12.0% |
| Samoans | 64.3 /100 | #162 | Good 12.0% |
| Navajo | 63.9 /100 | #163 | Good 12.0% |
| Swiss | 63.6 /100 | #164 | Good 12.0% |
| German Russians | 61.8 /100 | #165 | Good 12.0% |
| Tohono O'odham | 60.4 /100 | #166 | Good 12.0% |
| Ethiopians | 58.5 /100 | #167 | Average 12.0% |
| Serbians | 57.1 /100 | #168 | Average 12.0% |
| Immigrants | Peru | 57.0 /100 | #169 | Average 12.0% |
| Mexican American Indians | 55.8 /100 | #170 | Average 12.0% |
| Costa Ricans | 53.3 /100 | #171 | Average 12.0% |