Immigrants from Honduras vs Pennsylvania German Married-couple Households

COMPARE

Immigrants from Honduras
Race
Ancestry
AfghanAfricanAlaska NativeAlaskan AthabascanAlbanianAleutAlsatianAmericanApacheArabArapahoArgentineanArmenianAssyrian/Chaldean/SyriacAustralianAustrianBahamianBangladeshiBarbadianBasqueBelgianBelizeanBermudanBhutaneseBlackfeetBolivianBrazilianBritishBritish West IndianBulgarianBurmeseCajunCambodianCanadianCape VerdeanCarpatho RusynCelticCentral AmericanCentral American IndianCherokeeCheyenneChickasawChileanChineseChippewaChoctawColombianColvilleComancheCosta RicanCreeCreekCroatianCrowCubanCypriotCzechCzechoslovakianDanishDelawareDominicanDutchDutch West IndianEastern EuropeanEcuadorianEgyptianEnglishEstonianEthiopianEuropeanFijianFilipinoFinnishFrenchFrench American IndianFrench CanadianGermanGerman RussianGhanaianGreekGuamanian/ChamorroGuatemalanGuyaneseHaitianHmongHonduranHopiHoumaHungarianIcelanderIndian (Asian)IndonesianInupiatIranianIraqiIrishIroquoisIsraeliItalianJamaicanJapaneseJordanianKenyanKiowaKoreanLaotianLatvianLebaneseLiberianLithuanianLumbeeLuxembourgerMacedonianMalaysianMalteseMarshalleseMenomineeMexicanMexican American IndianMongolianMoroccanNative HawaiianNavajoNepaleseNew ZealanderNicaraguanNigerianNorthern EuropeanNorwegianOkinawanOsageOttawaPaiutePakistaniPalestinianPanamanianParaguayanPeruvianPimaPolishPortuguesePotawatomiPuebloPuerto RicanPuget Sound SalishRomanianRussianSalvadoranSamoanScandinavianScotch-IrishScottishSeminoleSenegaleseSerbianShoshoneSierra LeoneanSiouxSlavicSlovakSloveneSomaliSouth AfricanSouth AmericanSouth American IndianSoviet UnionSpaniardSpanishSpanish AmericanSpanish American IndianSri LankanSubsaharan AfricanSudaneseSwedishSwissSyrianTaiwaneseThaiTlingit-HaidaTohono O'OdhamTonganTrinidadian and TobagonianTsimshianTurkishU.S. Virgin IslanderUgandanUkrainianUruguayanUteVenezuelanVietnameseWelshWest IndianYakamaYaquiYugoslavianYumanYup'ikZimbabwean
Immigration
NonimmigrantsImmigrantsAfghanistanAfricaAlbaniaArgentinaArmeniaAsiaAustraliaAustriaBahamasBangladeshBarbadosBelarusBelgiumBelizeBoliviaBosnia and HerzegovinaBrazilBulgariaBurma/MyanmarCabo VerdeCambodiaCameroonCanadaCaribbeanCentral AmericaChileChinaColombiaCongoCosta RicaCroatiaCubaCzechoslovakiaDenmarkDominicaDominican RepublicEastern AfricaEastern AsiaEastern EuropeEcuadorEgyptEl SalvadorEnglandEritreaEthiopiaEuropeFijiFranceGermanyGhanaGreeceGrenadaGuatemalaGuyanaHaitiHondurasHong KongHungaryIndiaIndonesiaIranIraqIrelandIsraelItalyJamaicaJapanJordanKazakhstanKenyaKoreaKuwaitLaosLatin AmericaLatviaLebanonLiberiaLithuaniaMalaysiaMexicoMicronesiaMiddle AfricaMoldovaMoroccoNepalNetherlandsNicaraguaNigeriaNorth AmericaNorth MacedoniaNorthern AfricaNorthern EuropeNorwayOceaniaPakistanPanamaPeruPhilippinesPolandPortugalRomaniaRussiaSaudi ArabiaScotlandSenegalSerbiaSierra LeoneSingaporeSomaliaSouth AfricaSouth AmericaSouth Central AsiaSouth Eastern AsiaSouthern EuropeSpainSri LankaSt. Vincent and the GrenadinesSudanSwedenSwitzerlandSyriaTaiwanThailandTrinidad and TobagoTurkeyUgandaUkraineUruguayUzbekistanVenezuelaVietnamWest IndiesWestern AfricaWestern AsiaWestern EuropeYemenZaireZimbabweAzores
Pennsylvania German
Race
Ancestry
AfghanAfricanAlaska NativeAlaskan AthabascanAlbanianAleutAlsatianAmericanApacheArabArapahoArgentineanArmenianAssyrian/Chaldean/SyriacAustralianAustrianBahamianBangladeshiBarbadianBasqueBelgianBelizeanBermudanBhutaneseBlackfeetBolivianBrazilianBritishBritish West IndianBulgarianBurmeseCajunCambodianCanadianCape VerdeanCarpatho RusynCelticCentral AmericanCentral American IndianCherokeeCheyenneChickasawChileanChineseChippewaChoctawColombianColvilleComancheCosta RicanCreeCreekCroatianCrowCubanCypriotCzechCzechoslovakianDanishDelawareDominicanDutchDutch West IndianEastern EuropeanEcuadorianEgyptianEnglishEstonianEthiopianEuropeanFijianFilipinoFinnishFrenchFrench American IndianFrench CanadianGermanGerman RussianGhanaianGreekGuamanian/ChamorroGuatemalanGuyaneseHaitianHmongHonduranHopiHoumaHungarianIcelanderIndian (Asian)IndonesianInupiatIranianIraqiIrishIroquoisIsraeliItalianJamaicanJapaneseJordanianKenyanKiowaKoreanLaotianLatvianLebaneseLiberianLithuanianLumbeeLuxembourgerMacedonianMalaysianMalteseMarshalleseMenomineeMexicanMexican American IndianMongolianMoroccanNative HawaiianNavajoNepaleseNew ZealanderNicaraguanNigerianNorthern EuropeanNorwegianOkinawanOsageOttawaPaiutePakistaniPalestinianPanamanianParaguayanPennsylvania GermanPeruvianPimaPolishPortuguesePotawatomiPuebloPuerto RicanPuget Sound SalishRomanianRussianSalvadoranSamoanScandinavianScotch-IrishScottishSeminoleSenegaleseSerbianShoshoneSierra LeoneanSiouxSlavicSlovakSloveneSomaliSouth AfricanSouth AmericanSouth American IndianSoviet UnionSpaniardSpanishSpanish AmericanSpanish American IndianSri LankanSubsaharan AfricanSudaneseSwedishSwissSyrianTaiwaneseThaiTlingit-HaidaTohono O'OdhamTonganTrinidadian and TobagonianTsimshianTurkishU.S. Virgin IslanderUgandanUkrainianUruguayanUteVenezuelanVietnameseWelshWest IndianYakamaYaquiYugoslavianYumanYup'ikZimbabwean
Immigration
NonimmigrantsImmigrantsAfghanistanAfricaAlbaniaArgentinaArmeniaAsiaAustraliaAustriaBahamasBangladeshBarbadosBelarusBelgiumBelizeBoliviaBosnia and HerzegovinaBrazilBulgariaBurma/MyanmarCabo VerdeCambodiaCameroonCanadaCaribbeanCentral AmericaChileChinaColombiaCongoCosta RicaCroatiaCubaCzechoslovakiaDenmarkDominicaDominican RepublicEastern AfricaEastern AsiaEastern EuropeEcuadorEgyptEl SalvadorEnglandEritreaEthiopiaEuropeFijiFranceGermanyGhanaGreeceGrenadaGuatemalaGuyanaHaitiHong KongHungaryIndiaIndonesiaIranIraqIrelandIsraelItalyJamaicaJapanJordanKazakhstanKenyaKoreaKuwaitLaosLatin AmericaLatviaLebanonLiberiaLithuaniaMalaysiaMexicoMicronesiaMiddle AfricaMoldovaMoroccoNepalNetherlandsNicaraguaNigeriaNorth AmericaNorth MacedoniaNorthern AfricaNorthern EuropeNorwayOceaniaPakistanPanamaPeruPhilippinesPolandPortugalRomaniaRussiaSaudi ArabiaScotlandSenegalSerbiaSierra LeoneSingaporeSomaliaSouth AfricaSouth AmericaSouth Central AsiaSouth Eastern AsiaSouthern EuropeSpainSri LankaSt. Vincent and the GrenadinesSudanSwedenSwitzerlandSyriaTaiwanThailandTrinidad and TobagoTurkeyUgandaUkraineUruguayUzbekistanVenezuelaVietnamWest IndiesWestern AfricaWestern AsiaWestern EuropeYemenZaireZimbabweAzores
Married-couple Households
Income
Poverty
Unemployment
Labor Participation
Family Structure
Vehicle Availability
Education Level
Disability

Married-couple Households Comparison

Immigrants from Honduras

Pennsylvania Germans

Tragic
Exceptional
41.6%
MARRIED-COUPLE HOUSEHOLDS
0.0/ 100
METRIC RATING
302nd/ 347
METRIC RANK
50.4%
MARRIED-COUPLE HOUSEHOLDS
100.0/ 100
METRIC RATING
9th/ 347
METRIC RANK

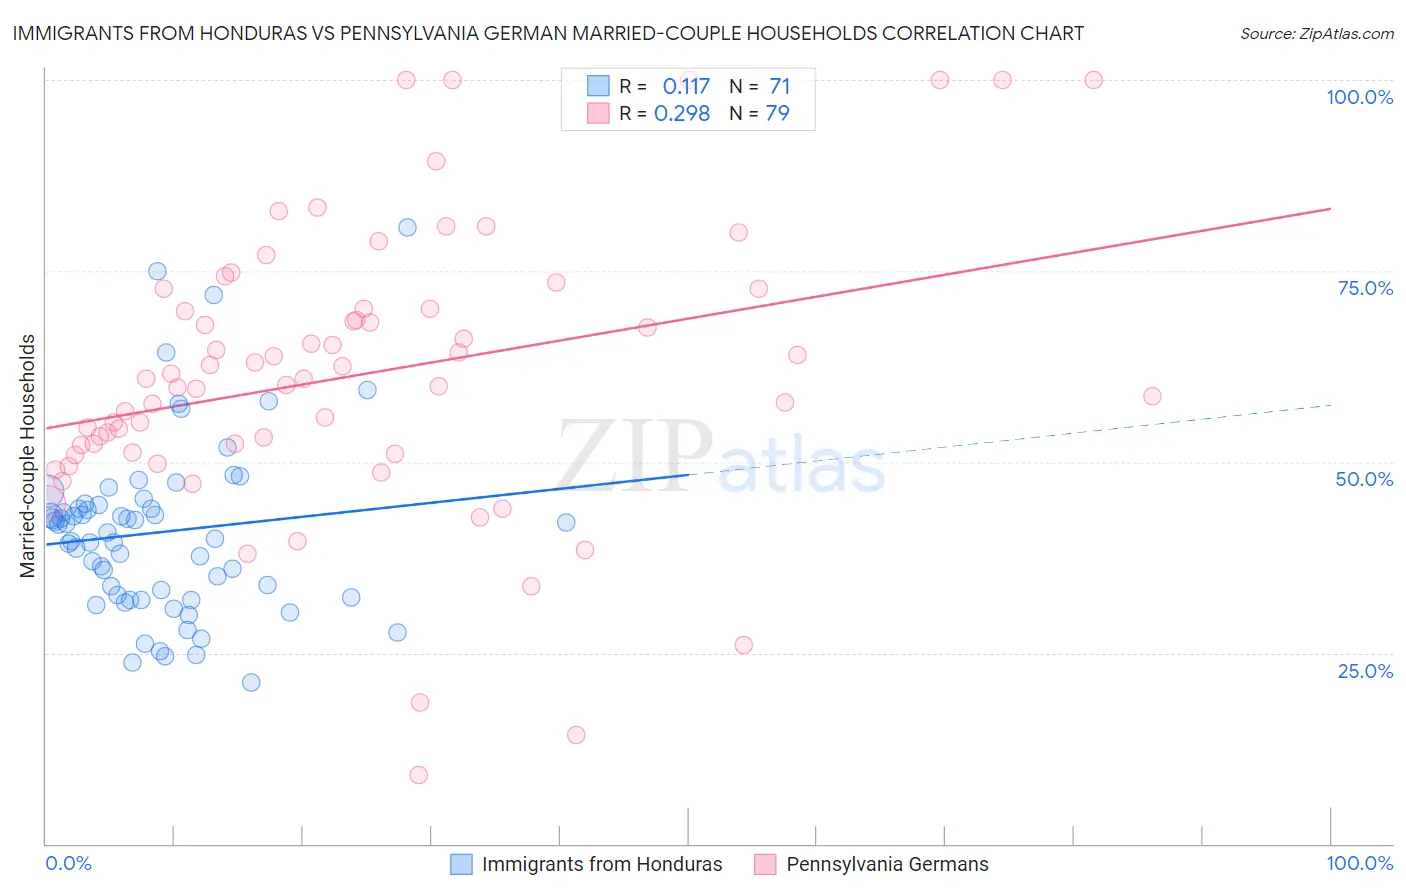
Immigrants from Honduras vs Pennsylvania German Married-couple Households Correlation Chart

The statistical analysis conducted on geographies consisting of 322,465,433 people shows a poor positive correlation between the proportion of Immigrants from Honduras and percentage of married-couple family households in the United States with a correlation coefficient (R) of 0.117 and weighted average of 41.6%. Similarly, the statistical analysis conducted on geographies consisting of 234,055,760 people shows a weak positive correlation between the proportion of Pennsylvania Germans and percentage of married-couple family households in the United States with a correlation coefficient (R) of 0.298 and weighted average of 50.4%, a difference of 21.0%.
Immigrants from Honduras vs Pennsylvania German Married-couple Households

Married-couple Households Correlation Summary

MeasurementImmigrants from HondurasPennsylvania German
Minimum21.2%9.0%
Maximum80.6%100.0%
Range59.5%91.0%
Mean40.8%61.4%
Median40.7%60.8%
Interquartile 25% (IQ1)32.3%51.2%
Interquartile 75% (IQ3)44.4%70.0%
Interquartile Range (IQR)12.1%18.8%
Standard Deviation (Sample)11.5%18.6%
Standard Deviation (Population)11.5%18.5%

Similar Demographics by Married-couple Households

Demographics Similar to Immigrants from Honduras by Married-couple Households

In terms of married-couple households, the demographic groups most similar to Immigrants from Honduras are Subsaharan African (41.6%, a difference of 0.0%), Immigrants from Guyana (41.6%, a difference of 0.12%), Immigrants from Bahamas (41.7%, a difference of 0.17%), Sioux (41.5%, a difference of 0.23%), and Immigrants from Belize (41.8%, a difference of 0.38%).
DemographicsRating | RankMarried-couple Households
Kiowa
0.0
/100
|
#295
Tragic
42.0%
Immigrants | Sudan
0.0
/100
|
#296
Tragic
41.9%
Arapaho
0.0
/100
|
#297
Tragic
41.8%
Immigrants | Middle Africa
0.0
/100
|
#298
Tragic
41.8%
Immigrants | Ghana
0.0
/100
|
#299
Tragic
41.8%
Immigrants | Belize
0.0
/100
|
#300
Tragic
41.8%
Immigrants | Bahamas
0.0
/100
|
#301
Tragic
41.7%
Immigrants | Honduras
0.0
/100
|
#302
Tragic
41.6%
Sub-Saharan Africans
0.0
/100
|
#303
Tragic
41.6%
Immigrants | Guyana
0.0
/100
|
#304
Tragic
41.6%
Sioux
0.0
/100
|
#305
Tragic
41.5%
Guyanese
0.0
/100
|
#306
Tragic
41.4%
Immigrants | Western Africa
0.0
/100
|
#307
Tragic
41.4%
Crow
0.0
/100
|
#308
Tragic
41.4%
Immigrants | Trinidad and Tobago
0.0
/100
|
#309
Tragic
41.2%

Demographics Similar to Pennsylvania Germans by Married-couple Households

In terms of married-couple households, the demographic groups most similar to Pennsylvania Germans are Chinese (50.4%, a difference of 0.0%), Immigrants from Pakistan (50.1%, a difference of 0.44%), Immigrants from South Central Asia (50.6%, a difference of 0.55%), Swiss (49.9%, a difference of 0.81%), and Immigrants from Korea (49.9%, a difference of 0.98%).
DemographicsRating | RankMarried-couple Households
Immigrants | Taiwan
100.0
/100
|
#2
Exceptional
52.4%
Thais
100.0
/100
|
#3
Exceptional
51.9%
Assyrians/Chaldeans/Syriacs
100.0
/100
|
#4
Exceptional
51.8%
Tongans
100.0
/100
|
#5
Exceptional
51.6%
Danes
100.0
/100
|
#6
Exceptional
51.1%
Filipinos
100.0
/100
|
#7
Exceptional
51.0%
Immigrants | South Central Asia
100.0
/100
|
#8
Exceptional
50.6%
Pennsylvania Germans
100.0
/100
|
#9
Exceptional
50.4%
Chinese
100.0
/100
|
#10
Exceptional
50.4%
Immigrants | Pakistan
100.0
/100
|
#11
Exceptional
50.1%
Swiss
100.0
/100
|
#12
Exceptional
49.9%
Immigrants | Korea
100.0
/100
|
#13
Exceptional
49.9%
Burmese
100.0
/100
|
#14
Exceptional
49.8%
Koreans
99.9
/100
|
#15
Exceptional
49.7%
Swedes
99.9
/100
|
#16
Exceptional
49.7%