Immigrants from Honduras vs Guyanese Average Family Size
COMPARE
Immigrants from Honduras
Guyanese
Average Family Size
Average Family Size Comparison
Immigrants from Honduras
Guyanese
3.36
AVERAGE FAMILY SIZE
100.0/ 100
METRIC RATING
55th/ 347
METRIC RANK
3.40
AVERAGE FAMILY SIZE
100.0/ 100
METRIC RATING
37th/ 347
METRIC RANK
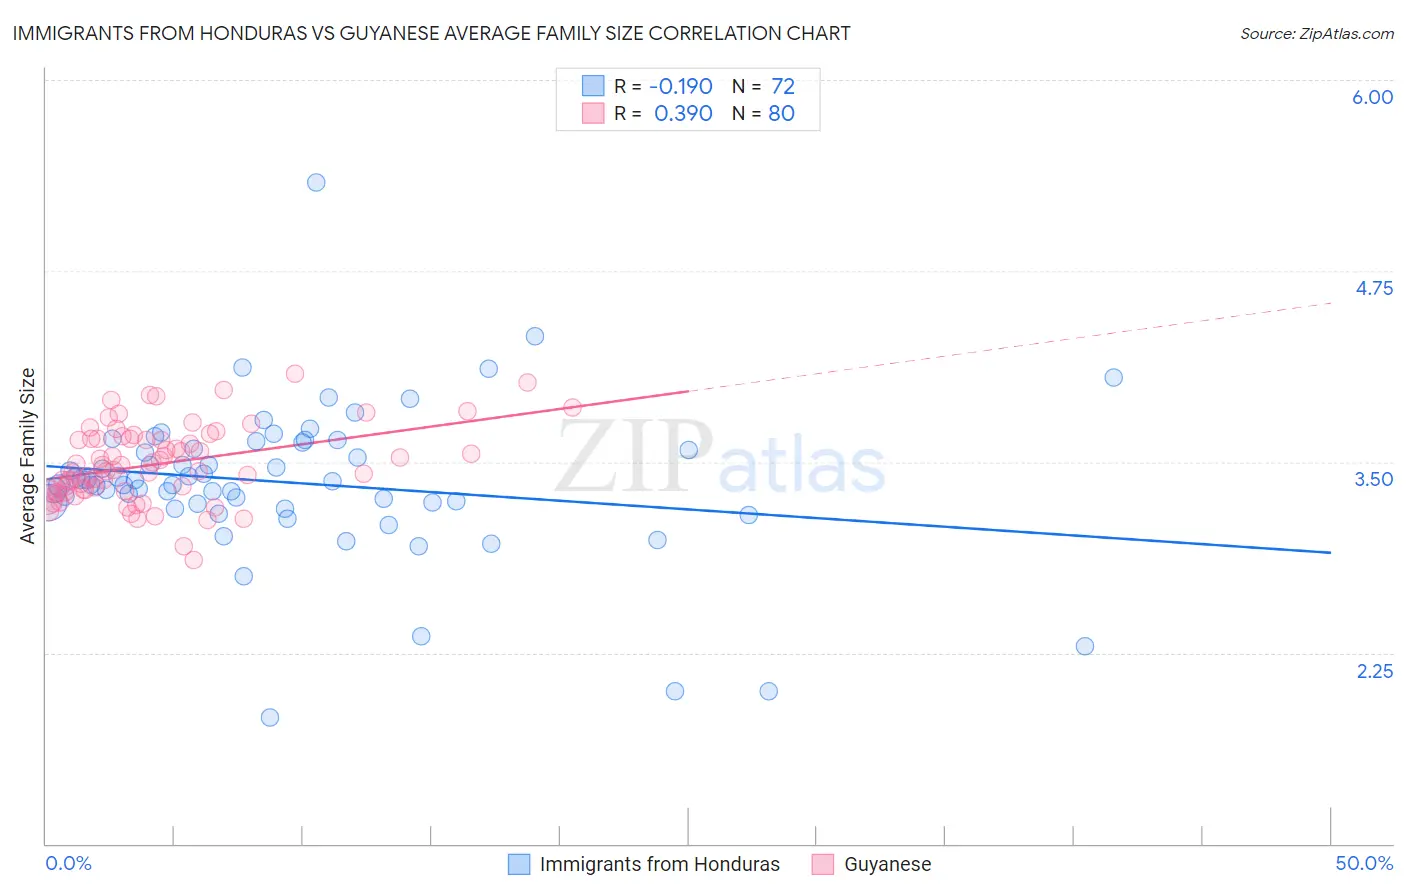
Immigrants from Honduras vs Guyanese Average Family Size Correlation Chart
The statistical analysis conducted on geographies consisting of 322,466,970 people shows a poor negative correlation between the proportion of Immigrants from Honduras and average family size in the United States with a correlation coefficient (R) of -0.190 and weighted average of 3.36. Similarly, the statistical analysis conducted on geographies consisting of 176,801,738 people shows a mild positive correlation between the proportion of Guyanese and average family size in the United States with a correlation coefficient (R) of 0.390 and weighted average of 3.40, a difference of 1.3%.
Average Family Size Correlation Summary
| Measurement | Immigrants from Honduras | Guyanese |
| Minimum | 1.83 | 2.86 |
| Maximum | 5.33 | 4.08 |
| Range | 3.50 | 1.22 |
| Mean | 3.36 | 3.49 |
| Median | 3.36 | 3.46 |
| Interquartile 25% (IQ1) | 3.23 | 3.31 |
| Interquartile 75% (IQ3) | 3.61 | 3.65 |
| Interquartile Range (IQR) | 0.38 | 0.34 |
| Standard Deviation (Sample) | 0.51 | 0.25 |
| Standard Deviation (Population) | 0.50 | 0.25 |
Demographics Similar to Immigrants from Honduras and Guyanese by Average Family Size
In terms of average family size, the demographic groups most similar to Immigrants from Honduras are Immigrants from South Eastern Asia (3.36, a difference of 0.040%), Korean (3.36, a difference of 0.060%), Immigrants from Dominican Republic (3.35, a difference of 0.070%), Fijian (3.36, a difference of 0.090%), and Nicaraguan (3.36, a difference of 0.14%). Similarly, the demographic groups most similar to Guyanese are Immigrants from Guyana (3.40, a difference of 0.14%), Immigrants from Belize (3.39, a difference of 0.16%), Immigrants from Haiti (3.39, a difference of 0.24%), Belizean (3.39, a difference of 0.36%), and Marshallese (3.38, a difference of 0.53%).
| Demographics | Rating | Rank | Average Family Size |
| Immigrants | Guyana | 100.0 /100 | #36 | Exceptional 3.40 |
| Guyanese | 100.0 /100 | #37 | Exceptional 3.40 |
| Immigrants | Belize | 100.0 /100 | #38 | Exceptional 3.39 |
| Immigrants | Haiti | 100.0 /100 | #39 | Exceptional 3.39 |
| Belizeans | 100.0 /100 | #40 | Exceptional 3.39 |
| Marshallese | 100.0 /100 | #41 | Exceptional 3.38 |
| Immigrants | Vietnam | 100.0 /100 | #42 | Exceptional 3.38 |
| Immigrants | Philippines | 100.0 /100 | #43 | Exceptional 3.37 |
| Alaska Natives | 100.0 /100 | #44 | Exceptional 3.37 |
| Shoshone | 100.0 /100 | #45 | Exceptional 3.37 |
| Haitians | 100.0 /100 | #46 | Exceptional 3.37 |
| Vietnamese | 100.0 /100 | #47 | Exceptional 3.37 |
| Immigrants | Nicaragua | 100.0 /100 | #48 | Exceptional 3.37 |
| Bangladeshis | 100.0 /100 | #49 | Exceptional 3.37 |
| Immigrants | Bangladesh | 100.0 /100 | #50 | Exceptional 3.36 |
| Nicaraguans | 100.0 /100 | #51 | Exceptional 3.36 |
| Fijians | 100.0 /100 | #52 | Exceptional 3.36 |
| Koreans | 100.0 /100 | #53 | Exceptional 3.36 |
| Immigrants | South Eastern Asia | 100.0 /100 | #54 | Exceptional 3.36 |
| Immigrants | Honduras | 100.0 /100 | #55 | Exceptional 3.36 |
| Immigrants | Dominican Republic | 100.0 /100 | #56 | Exceptional 3.35 |