Immigrants from Haiti vs Dutch Divorced or Separated
COMPARE
Immigrants from Haiti
Dutch
Divorced or Separated
Divorced or Separated Comparison
Immigrants from Haiti
Dutch
13.4%
DIVORCED OR SEPARATED
0.0/ 100
METRIC RATING
322nd/ 347
METRIC RANK
12.4%
DIVORCED OR SEPARATED
3.1/ 100
METRIC RATING
242nd/ 347
METRIC RANK
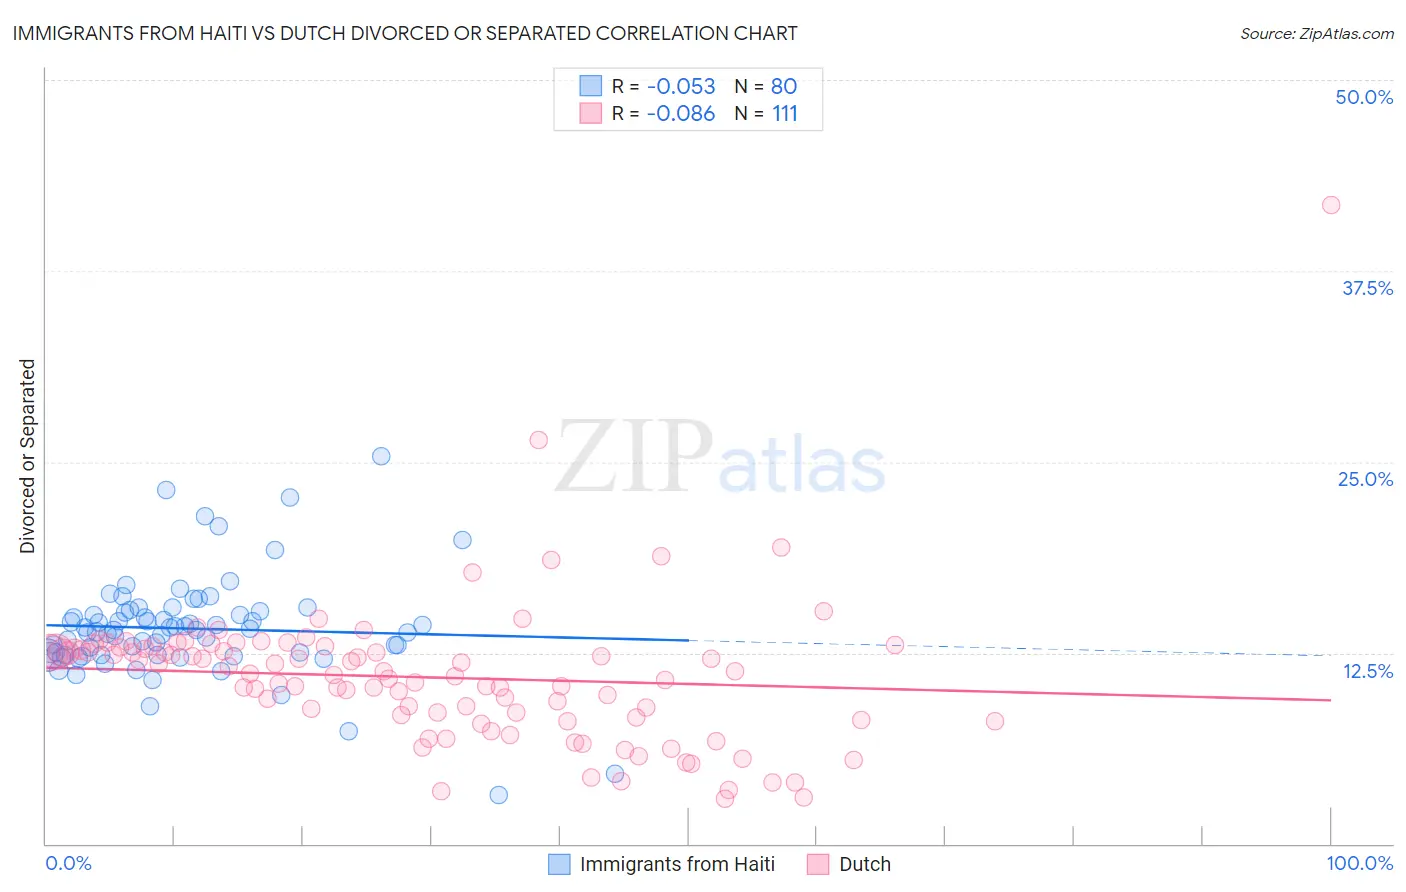
Immigrants from Haiti vs Dutch Divorced or Separated Correlation Chart
The statistical analysis conducted on geographies consisting of 225,208,524 people shows a slight negative correlation between the proportion of Immigrants from Haiti and percentage of population currently divorced or separated in the United States with a correlation coefficient (R) of -0.053 and weighted average of 13.4%. Similarly, the statistical analysis conducted on geographies consisting of 553,980,787 people shows a slight negative correlation between the proportion of Dutch and percentage of population currently divorced or separated in the United States with a correlation coefficient (R) of -0.086 and weighted average of 12.4%, a difference of 8.0%.
Divorced or Separated Correlation Summary
| Measurement | Immigrants from Haiti | Dutch |
| Minimum | 3.2% | 3.0% |
| Maximum | 25.4% | 41.8% |
| Range | 22.2% | 38.9% |
| Mean | 14.1% | 10.9% |
| Median | 14.0% | 11.1% |
| Interquartile 25% (IQ1) | 12.4% | 8.3% |
| Interquartile 75% (IQ3) | 15.2% | 12.8% |
| Interquartile Range (IQR) | 2.8% | 4.5% |
| Standard Deviation (Sample) | 3.4% | 4.7% |
| Standard Deviation (Population) | 3.4% | 4.7% |
Similar Demographics by Divorced or Separated
Demographics Similar to Immigrants from Haiti by Divorced or Separated
In terms of divorced or separated, the demographic groups most similar to Immigrants from Haiti are U.S. Virgin Islander (13.4%, a difference of 0.22%), Cheyenne (13.4%, a difference of 0.24%), Osage (13.4%, a difference of 0.29%), Cajun (13.4%, a difference of 0.34%), and Potawatomi (13.5%, a difference of 0.35%).
| Demographics | Rating | Rank | Divorced or Separated |
| Spanish Americans | 0.0 /100 | #315 | Tragic 13.3% |
| Tsimshian | 0.0 /100 | #316 | Tragic 13.3% |
| Haitians | 0.0 /100 | #317 | Tragic 13.3% |
| Cree | 0.0 /100 | #318 | Tragic 13.4% |
| Puget Sound Salish | 0.0 /100 | #319 | Tragic 13.4% |
| Cajuns | 0.0 /100 | #320 | Tragic 13.4% |
| Cheyenne | 0.0 /100 | #321 | Tragic 13.4% |
| Immigrants | Haiti | 0.0 /100 | #322 | Tragic 13.4% |
| U.S. Virgin Islanders | 0.0 /100 | #323 | Tragic 13.4% |
| Osage | 0.0 /100 | #324 | Tragic 13.4% |
| Potawatomi | 0.0 /100 | #325 | Tragic 13.5% |
| Immigrants | Congo | 0.0 /100 | #326 | Tragic 13.5% |
| Comanche | 0.0 /100 | #327 | Tragic 13.5% |
| Immigrants | Caribbean | 0.0 /100 | #328 | Tragic 13.6% |
| Houma | 0.0 /100 | #329 | Tragic 13.6% |
Demographics Similar to Dutch by Divorced or Separated
In terms of divorced or separated, the demographic groups most similar to Dutch are Immigrants from Latin America (12.4%, a difference of 0.070%), Uruguayan (12.4%, a difference of 0.090%), British West Indian (12.4%, a difference of 0.17%), Alaska Native (12.4%, a difference of 0.17%), and Immigrants from Germany (12.4%, a difference of 0.23%).
| Demographics | Rating | Rank | Divorced or Separated |
| Immigrants | Bosnia and Herzegovina | 4.3 /100 | #235 | Tragic 12.4% |
| Colombians | 4.2 /100 | #236 | Tragic 12.4% |
| Immigrants | Laos | 4.2 /100 | #237 | Tragic 12.4% |
| Sudanese | 4.0 /100 | #238 | Tragic 12.4% |
| Immigrants | Germany | 4.0 /100 | #239 | Tragic 12.4% |
| British West Indians | 3.7 /100 | #240 | Tragic 12.4% |
| Uruguayans | 3.4 /100 | #241 | Tragic 12.4% |
| Dutch | 3.1 /100 | #242 | Tragic 12.4% |
| Immigrants | Latin America | 2.8 /100 | #243 | Tragic 12.4% |
| Alaska Natives | 2.5 /100 | #244 | Tragic 12.4% |
| Hispanics or Latinos | 2.0 /100 | #245 | Tragic 12.5% |
| Immigrants | West Indies | 1.9 /100 | #246 | Tragic 12.5% |
| Germans | 1.8 /100 | #247 | Tragic 12.5% |
| Nepalese | 1.8 /100 | #248 | Tragic 12.5% |
| Finns | 1.8 /100 | #249 | Tragic 12.5% |