Immigrants from Guatemala vs Luxembourger Divorced or Separated
COMPARE
Immigrants from Guatemala
Luxembourger
Divorced or Separated
Divorced or Separated Comparison
Immigrants from Guatemala
Luxembourgers
12.2%
DIVORCED OR SEPARATED
23.2/ 100
METRIC RATING
203rd/ 347
METRIC RANK
11.3%
DIVORCED OR SEPARATED
99.9/ 100
METRIC RATING
62nd/ 347
METRIC RANK
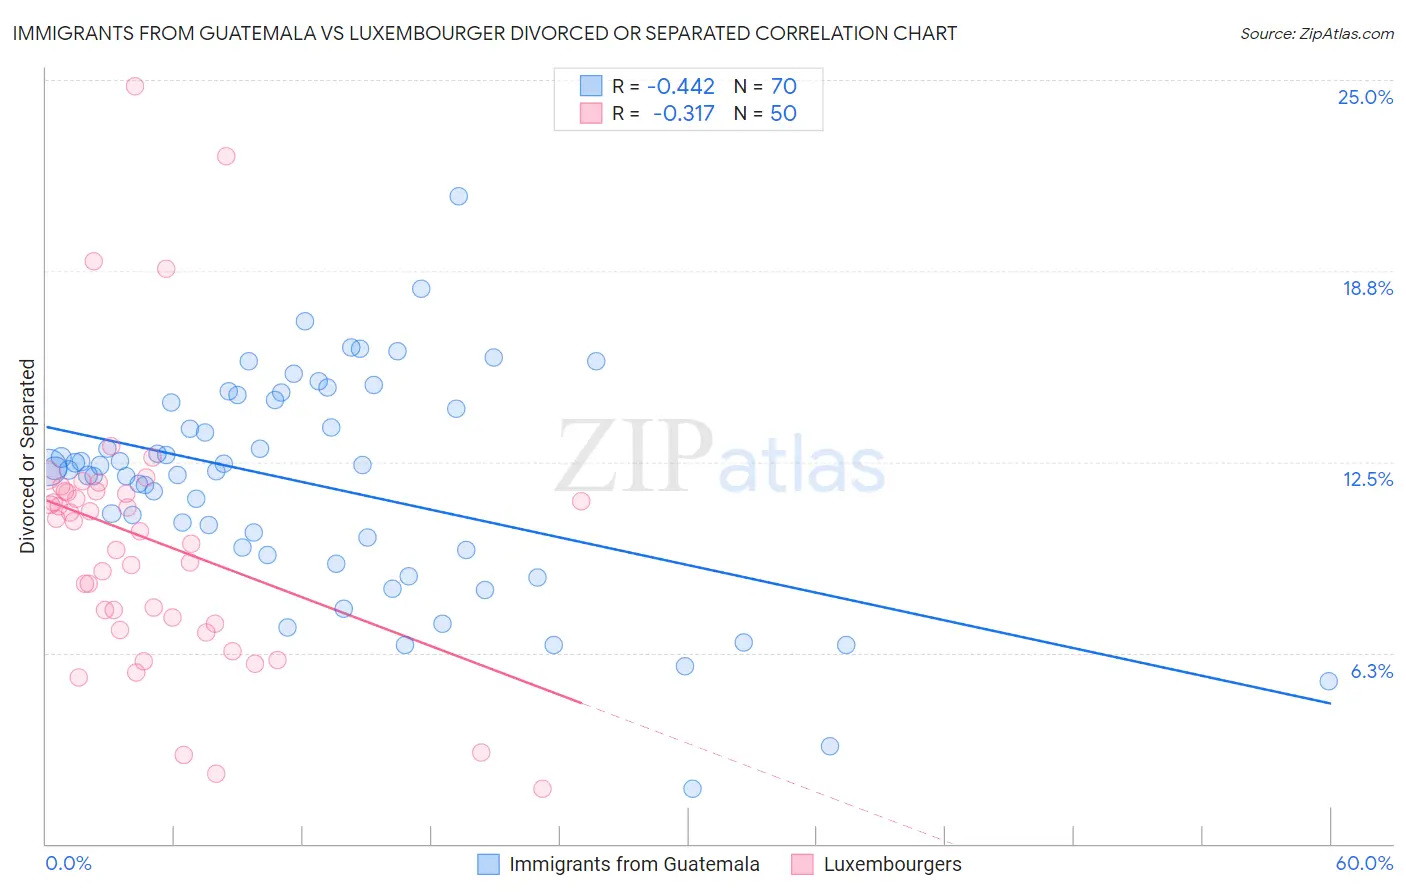
Immigrants from Guatemala vs Luxembourger Divorced or Separated Correlation Chart
The statistical analysis conducted on geographies consisting of 377,229,357 people shows a moderate negative correlation between the proportion of Immigrants from Guatemala and percentage of population currently divorced or separated in the United States with a correlation coefficient (R) of -0.442 and weighted average of 12.2%. Similarly, the statistical analysis conducted on geographies consisting of 144,652,195 people shows a mild negative correlation between the proportion of Luxembourgers and percentage of population currently divorced or separated in the United States with a correlation coefficient (R) of -0.317 and weighted average of 11.3%, a difference of 7.3%.
Divorced or Separated Correlation Summary
| Measurement | Immigrants from Guatemala | Luxembourger |
| Minimum | 1.8% | 1.8% |
| Maximum | 21.2% | 24.8% |
| Range | 19.4% | 23.0% |
| Mean | 11.7% | 9.9% |
| Median | 12.3% | 10.4% |
| Interquartile 25% (IQ1) | 9.6% | 7.2% |
| Interquartile 75% (IQ3) | 14.4% | 11.5% |
| Interquartile Range (IQR) | 4.8% | 4.3% |
| Standard Deviation (Sample) | 3.6% | 4.5% |
| Standard Deviation (Population) | 3.5% | 4.4% |
Similar Demographics by Divorced or Separated
Demographics Similar to Immigrants from Guatemala by Divorced or Separated
In terms of divorced or separated, the demographic groups most similar to Immigrants from Guatemala are Portuguese (12.2%, a difference of 0.020%), Kenyan (12.2%, a difference of 0.070%), Immigrants from Costa Rica (12.2%, a difference of 0.10%), Slovak (12.2%, a difference of 0.11%), and Mexican (12.2%, a difference of 0.11%).
| Demographics | Rating | Rank | Divorced or Separated |
| Immigrants | Burma/Myanmar | 30.4 /100 | #196 | Fair 12.1% |
| Immigrants | Africa | 30.3 /100 | #197 | Fair 12.1% |
| Nigerians | 30.1 /100 | #198 | Fair 12.1% |
| Central Americans | 29.4 /100 | #199 | Fair 12.1% |
| South Americans | 28.6 /100 | #200 | Fair 12.2% |
| Guatemalans | 26.9 /100 | #201 | Fair 12.2% |
| Portuguese | 23.5 /100 | #202 | Fair 12.2% |
| Immigrants | Guatemala | 23.2 /100 | #203 | Fair 12.2% |
| Kenyans | 21.8 /100 | #204 | Fair 12.2% |
| Immigrants | Costa Rica | 21.3 /100 | #205 | Fair 12.2% |
| Slovaks | 21.0 /100 | #206 | Fair 12.2% |
| Mexicans | 21.0 /100 | #207 | Fair 12.2% |
| Immigrants | Ghana | 18.8 /100 | #208 | Poor 12.2% |
| Immigrants | Trinidad and Tobago | 17.8 /100 | #209 | Poor 12.2% |
| Slavs | 17.0 /100 | #210 | Poor 12.2% |
Demographics Similar to Luxembourgers by Divorced or Separated
In terms of divorced or separated, the demographic groups most similar to Luxembourgers are Korean (11.3%, a difference of 0.0%), Immigrants from Russia (11.3%, a difference of 0.010%), Immigrants from Kuwait (11.3%, a difference of 0.010%), Israeli (11.3%, a difference of 0.17%), and Sri Lankan (11.3%, a difference of 0.27%).
| Demographics | Rating | Rank | Divorced or Separated |
| Immigrants | Yemen | 99.9 /100 | #55 | Exceptional 11.3% |
| Immigrants | Philippines | 99.9 /100 | #56 | Exceptional 11.3% |
| Immigrants | Vietnam | 99.9 /100 | #57 | Exceptional 11.3% |
| Sri Lankans | 99.9 /100 | #58 | Exceptional 11.3% |
| Israelis | 99.9 /100 | #59 | Exceptional 11.3% |
| Immigrants | Russia | 99.9 /100 | #60 | Exceptional 11.3% |
| Koreans | 99.9 /100 | #61 | Exceptional 11.3% |
| Luxembourgers | 99.9 /100 | #62 | Exceptional 11.3% |
| Immigrants | Kuwait | 99.9 /100 | #63 | Exceptional 11.3% |
| Macedonians | 99.8 /100 | #64 | Exceptional 11.4% |
| Immigrants | South Eastern Asia | 99.8 /100 | #65 | Exceptional 11.4% |
| Inupiat | 99.8 /100 | #66 | Exceptional 11.4% |
| Immigrants | Syria | 99.7 /100 | #67 | Exceptional 11.4% |
| Palestinians | 99.7 /100 | #68 | Exceptional 11.5% |
| Immigrants | Belgium | 99.7 /100 | #69 | Exceptional 11.5% |