Immigrants from Greece vs Thai Single Mother Households
COMPARE
Immigrants from Greece
Thai
Single Mother Households
Single Mother Households Comparison
Immigrants from Greece
Thais
5.4%
SINGLE MOTHER HOUSEHOLDS
99.5/ 100
METRIC RATING
41st/ 347
METRIC RANK
5.2%
SINGLE MOTHER HOUSEHOLDS
99.8/ 100
METRIC RATING
22nd/ 347
METRIC RANK
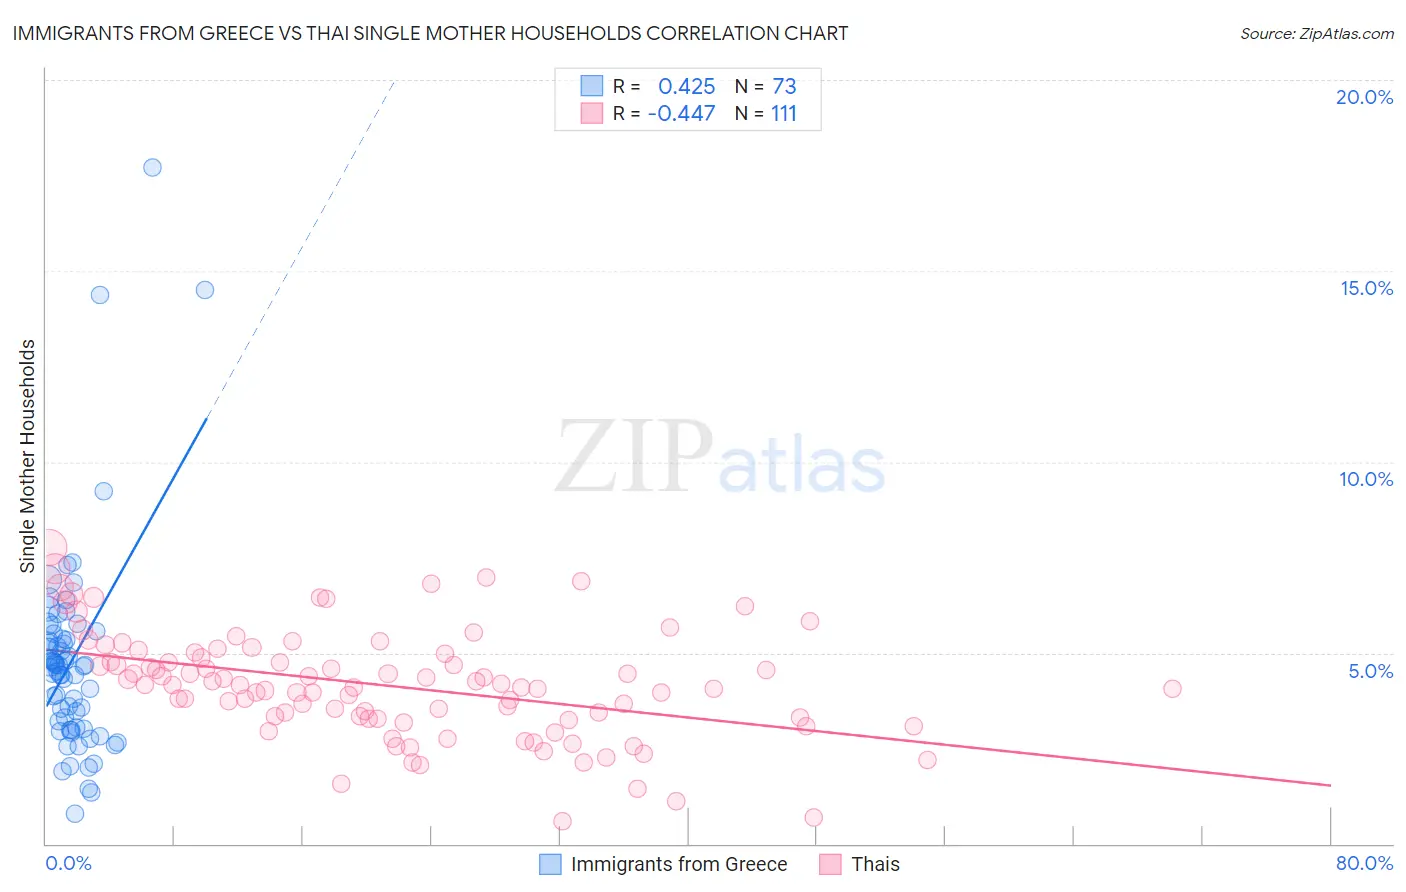
Immigrants from Greece vs Thai Single Mother Households Correlation Chart
The statistical analysis conducted on geographies consisting of 216,428,324 people shows a moderate positive correlation between the proportion of Immigrants from Greece and percentage of single mother households in the United States with a correlation coefficient (R) of 0.425 and weighted average of 5.4%. Similarly, the statistical analysis conducted on geographies consisting of 474,117,611 people shows a moderate negative correlation between the proportion of Thais and percentage of single mother households in the United States with a correlation coefficient (R) of -0.447 and weighted average of 5.2%, a difference of 3.1%.
Single Mother Households Correlation Summary
| Measurement | Immigrants from Greece | Thai |
| Minimum | 0.80% | 0.60% |
| Maximum | 17.7% | 7.8% |
| Range | 16.9% | 7.2% |
| Mean | 4.8% | 4.1% |
| Median | 4.7% | 4.1% |
| Interquartile 25% (IQ1) | 3.0% | 3.3% |
| Interquartile 75% (IQ3) | 5.4% | 5.0% |
| Interquartile Range (IQR) | 2.4% | 1.7% |
| Standard Deviation (Sample) | 2.7% | 1.4% |
| Standard Deviation (Population) | 2.7% | 1.4% |
Demographics Similar to Immigrants from Greece and Thais by Single Mother Households
In terms of single mother households, the demographic groups most similar to Immigrants from Greece are Estonian (5.4%, a difference of 0.42%), Immigrants from Sweden (5.4%, a difference of 0.53%), Immigrants from Serbia (5.4%, a difference of 0.67%), Immigrants from Belgium (5.3%, a difference of 1.1%), and Immigrants from Czechoslovakia (5.3%, a difference of 1.3%). Similarly, the demographic groups most similar to Thais are Immigrants from Austria (5.2%, a difference of 0.050%), Armenian (5.2%, a difference of 0.11%), Immigrants from Japan (5.2%, a difference of 0.44%), Immigrants from Lithuania (5.3%, a difference of 0.47%), and Eastern European (5.2%, a difference of 0.72%).
| Demographics | Rating | Rank | Single Mother Households |
| Eastern Europeans | 99.8 /100 | #21 | Exceptional 5.2% |
| Thais | 99.8 /100 | #22 | Exceptional 5.2% |
| Immigrants | Austria | 99.8 /100 | #23 | Exceptional 5.2% |
| Armenians | 99.8 /100 | #24 | Exceptional 5.2% |
| Immigrants | Japan | 99.8 /100 | #25 | Exceptional 5.2% |
| Immigrants | Lithuania | 99.8 /100 | #26 | Exceptional 5.3% |
| Bhutanese | 99.7 /100 | #27 | Exceptional 5.3% |
| Russians | 99.7 /100 | #28 | Exceptional 5.3% |
| Latvians | 99.7 /100 | #29 | Exceptional 5.3% |
| Burmese | 99.7 /100 | #30 | Exceptional 5.3% |
| Immigrants | Korea | 99.7 /100 | #31 | Exceptional 5.3% |
| Cambodians | 99.7 /100 | #32 | Exceptional 5.3% |
| Immigrants | Switzerland | 99.7 /100 | #33 | Exceptional 5.3% |
| Bulgarians | 99.7 /100 | #34 | Exceptional 5.3% |
| Immigrants | Northern Europe | 99.7 /100 | #35 | Exceptional 5.3% |
| Immigrants | Czechoslovakia | 99.7 /100 | #36 | Exceptional 5.3% |
| Immigrants | Belgium | 99.7 /100 | #37 | Exceptional 5.3% |
| Immigrants | Serbia | 99.6 /100 | #38 | Exceptional 5.4% |
| Immigrants | Sweden | 99.6 /100 | #39 | Exceptional 5.4% |
| Estonians | 99.6 /100 | #40 | Exceptional 5.4% |
| Immigrants | Greece | 99.5 /100 | #41 | Exceptional 5.4% |