Immigrants from Greece vs Russian Births to Unmarried Women
COMPARE
Immigrants from Greece
Russian
Births to Unmarried Women
Births to Unmarried Women Comparison
Immigrants from Greece
Russians
27.8%
BIRTHS TO UNMARRIED WOMEN
99.4/ 100
METRIC RATING
49th/ 347
METRIC RANK
28.0%
BIRTHS TO UNMARRIED WOMEN
99.2/ 100
METRIC RATING
57th/ 347
METRIC RANK
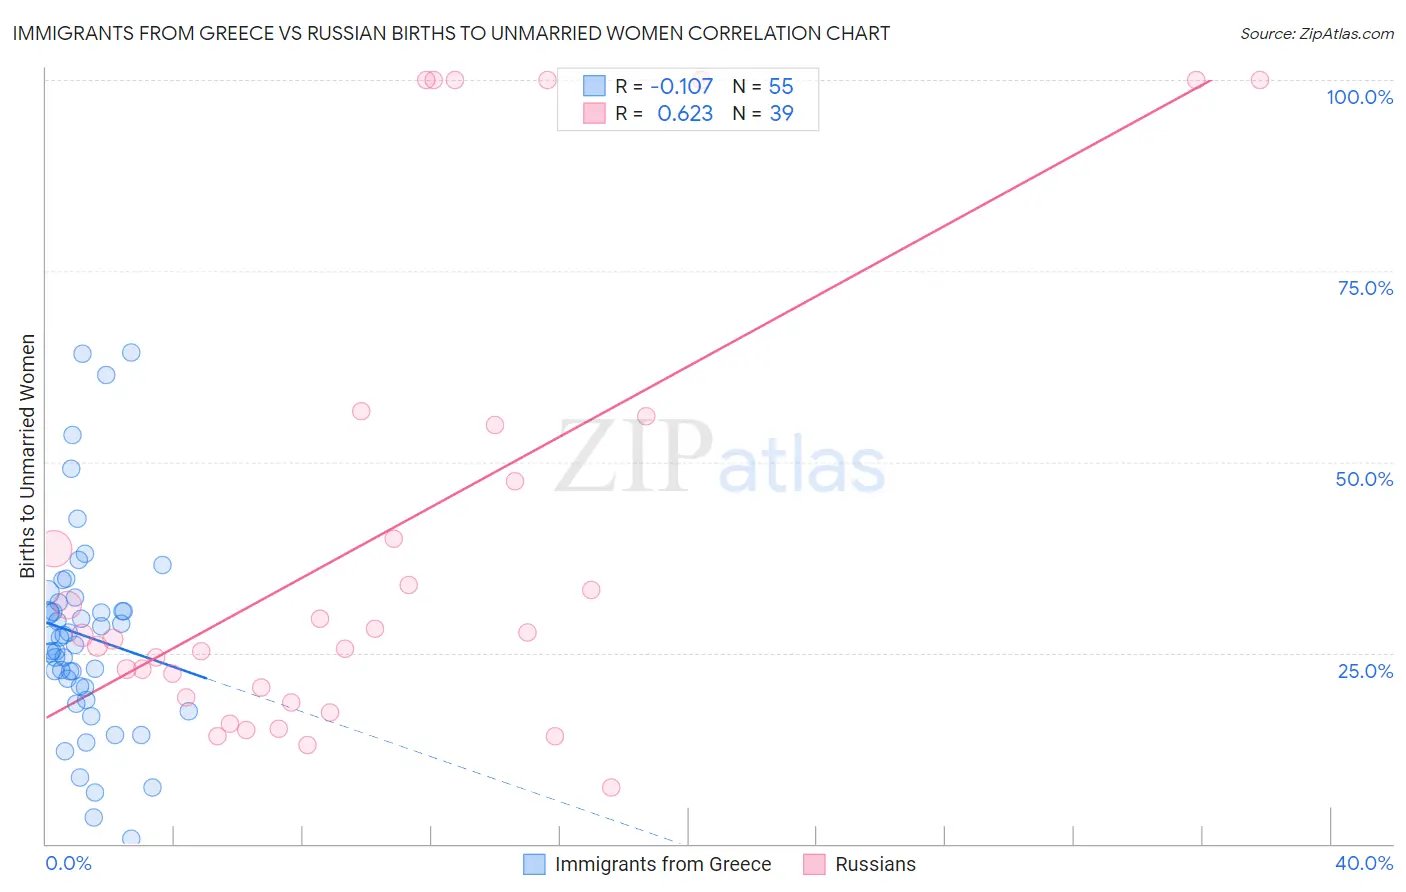
Immigrants from Greece vs Russian Births to Unmarried Women Correlation Chart
The statistical analysis conducted on geographies consisting of 203,732,129 people shows a poor negative correlation between the proportion of Immigrants from Greece and percentage of births to unmarried women in the United States with a correlation coefficient (R) of -0.107 and weighted average of 27.8%. Similarly, the statistical analysis conducted on geographies consisting of 462,642,937 people shows a significant positive correlation between the proportion of Russians and percentage of births to unmarried women in the United States with a correlation coefficient (R) of 0.623 and weighted average of 28.0%, a difference of 0.81%.
Births to Unmarried Women Correlation Summary
| Measurement | Immigrants from Greece | Russian |
| Minimum | 0.70% | 7.4% |
| Maximum | 64.4% | 100.0% |
| Range | 63.7% | 92.6% |
| Mean | 27.2% | 40.2% |
| Median | 27.1% | 27.3% |
| Interquartile 25% (IQ1) | 20.5% | 19.1% |
| Interquartile 75% (IQ3) | 31.6% | 54.9% |
| Interquartile Range (IQR) | 11.1% | 35.7% |
| Standard Deviation (Sample) | 13.4% | 30.6% |
| Standard Deviation (Population) | 13.3% | 30.2% |
Demographics Similar to Immigrants from Greece and Russians by Births to Unmarried Women
In terms of births to unmarried women, the demographic groups most similar to Immigrants from Greece are Maltese (27.8%, a difference of 0.12%), Eastern European (27.7%, a difference of 0.19%), Immigrants from Lithuania (27.7%, a difference of 0.20%), Hmong (27.7%, a difference of 0.20%), and Latvian (27.7%, a difference of 0.24%). Similarly, the demographic groups most similar to Russians are Immigrants from Albania (28.0%, a difference of 0.11%), Immigrants from Belgium (28.0%, a difference of 0.13%), Immigrants from Kazakhstan (28.1%, a difference of 0.36%), Mongolian (27.9%, a difference of 0.39%), and Immigrants from Turkey (28.1%, a difference of 0.41%).
| Demographics | Rating | Rank | Births to Unmarried Women |
| Immigrants | Bulgaria | 99.6 /100 | #43 | Exceptional 27.6% |
| Immigrants | Indonesia | 99.5 /100 | #44 | Exceptional 27.7% |
| Latvians | 99.5 /100 | #45 | Exceptional 27.7% |
| Immigrants | Lithuania | 99.5 /100 | #46 | Exceptional 27.7% |
| Hmong | 99.5 /100 | #47 | Exceptional 27.7% |
| Eastern Europeans | 99.5 /100 | #48 | Exceptional 27.7% |
| Immigrants | Greece | 99.4 /100 | #49 | Exceptional 27.8% |
| Maltese | 99.4 /100 | #50 | Exceptional 27.8% |
| Macedonians | 99.4 /100 | #51 | Exceptional 27.9% |
| Bhutanese | 99.4 /100 | #52 | Exceptional 27.9% |
| Immigrants | Romania | 99.4 /100 | #53 | Exceptional 27.9% |
| Afghans | 99.4 /100 | #54 | Exceptional 27.9% |
| Mongolians | 99.3 /100 | #55 | Exceptional 27.9% |
| Immigrants | Belgium | 99.3 /100 | #56 | Exceptional 28.0% |
| Russians | 99.2 /100 | #57 | Exceptional 28.0% |
| Immigrants | Albania | 99.2 /100 | #58 | Exceptional 28.0% |
| Immigrants | Kazakhstan | 99.1 /100 | #59 | Exceptional 28.1% |
| Immigrants | Turkey | 99.1 /100 | #60 | Exceptional 28.1% |
| Immigrants | North Macedonia | 99.1 /100 | #61 | Exceptional 28.1% |
| Egyptians | 99.0 /100 | #62 | Exceptional 28.2% |
| Immigrants | Serbia | 98.9 /100 | #63 | Exceptional 28.3% |