Immigrants from Greece vs French American Indian Single Father Households
COMPARE
Immigrants from Greece
French American Indian
Single Father Households
Single Father Households Comparison
Immigrants from Greece
French American Indians
1.9%
SINGLE FATHER HOUSEHOLDS
100.0/ 100
METRIC RATING
12th/ 347
METRIC RANK
2.6%
SINGLE FATHER HOUSEHOLDS
0.5/ 100
METRIC RATING
266th/ 347
METRIC RANK
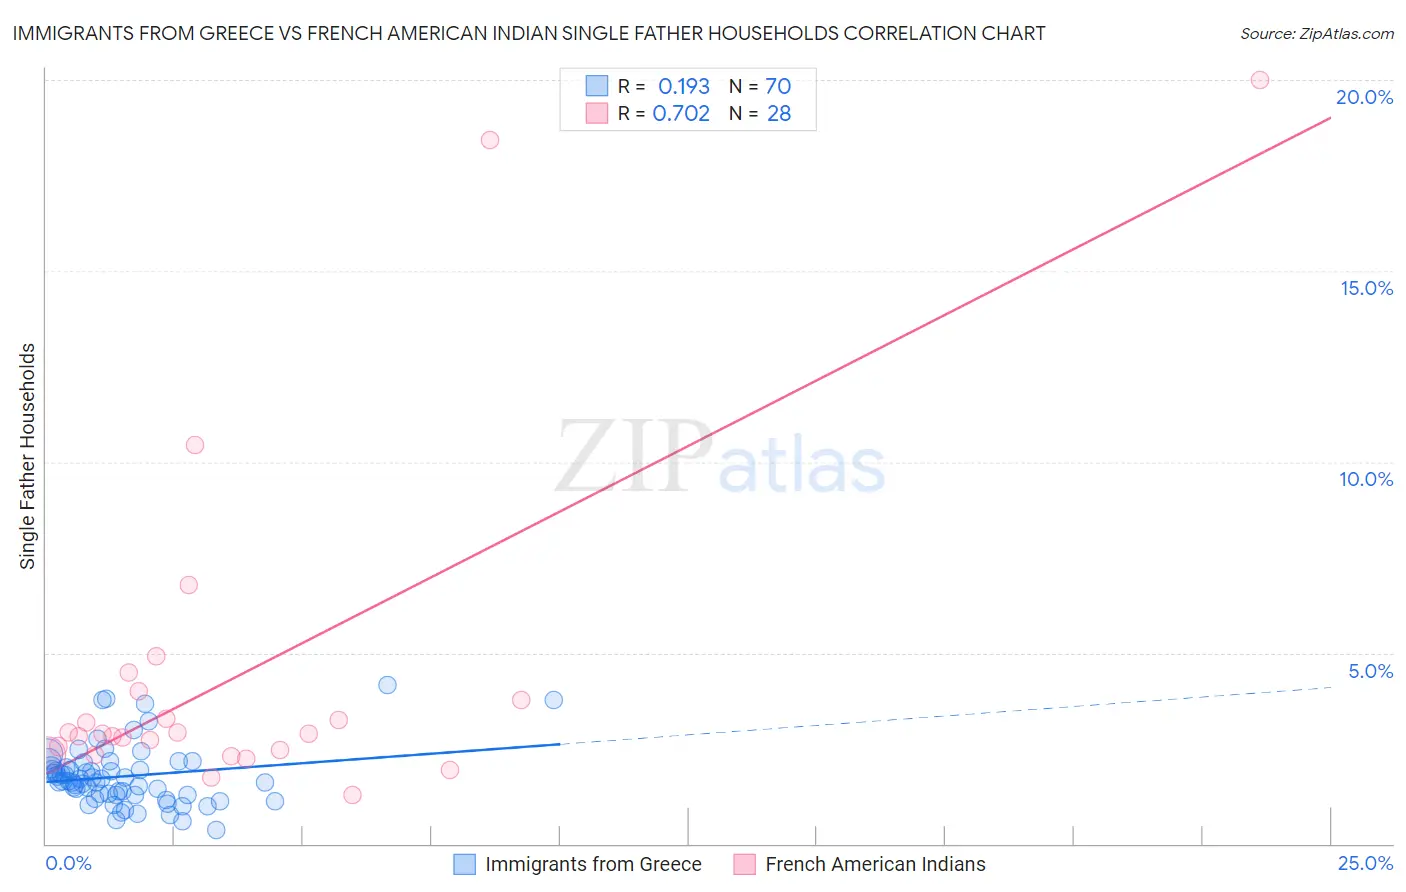
Immigrants from Greece vs French American Indian Single Father Households Correlation Chart
The statistical analysis conducted on geographies consisting of 215,474,728 people shows a poor positive correlation between the proportion of Immigrants from Greece and percentage of single father households in the United States with a correlation coefficient (R) of 0.193 and weighted average of 1.9%. Similarly, the statistical analysis conducted on geographies consisting of 131,604,118 people shows a strong positive correlation between the proportion of French American Indians and percentage of single father households in the United States with a correlation coefficient (R) of 0.702 and weighted average of 2.6%, a difference of 37.5%.
Single Father Households Correlation Summary
| Measurement | Immigrants from Greece | French American Indian |
| Minimum | 0.34% | 1.3% |
| Maximum | 4.2% | 20.0% |
| Range | 3.8% | 18.7% |
| Mean | 1.8% | 4.4% |
| Median | 1.7% | 2.9% |
| Interquartile 25% (IQ1) | 1.3% | 2.4% |
| Interquartile 75% (IQ3) | 2.0% | 3.9% |
| Interquartile Range (IQR) | 0.73% | 1.5% |
| Standard Deviation (Sample) | 0.80% | 4.5% |
| Standard Deviation (Population) | 0.79% | 4.4% |
Similar Demographics by Single Father Households
Demographics Similar to Immigrants from Greece by Single Father Households
In terms of single father households, the demographic groups most similar to Immigrants from Greece are Immigrants from Singapore (1.9%, a difference of 0.030%), Immigrants from Belarus (1.9%, a difference of 0.44%), Okinawan (1.9%, a difference of 0.76%), Immigrants from Lithuania (1.9%, a difference of 1.0%), and Immigrants from China (1.8%, a difference of 1.1%).
| Demographics | Rating | Rank | Single Father Households |
| Immigrants | Hong Kong | 100.0 /100 | #5 | Exceptional 1.8% |
| Immigrants | Taiwan | 100.0 /100 | #6 | Exceptional 1.8% |
| Cypriots | 100.0 /100 | #7 | Exceptional 1.8% |
| Immigrants | Ireland | 100.0 /100 | #8 | Exceptional 1.8% |
| Immigrants | China | 100.0 /100 | #9 | Exceptional 1.8% |
| Okinawans | 100.0 /100 | #10 | Exceptional 1.9% |
| Immigrants | Belarus | 100.0 /100 | #11 | Exceptional 1.9% |
| Immigrants | Greece | 100.0 /100 | #12 | Exceptional 1.9% |
| Immigrants | Singapore | 100.0 /100 | #13 | Exceptional 1.9% |
| Immigrants | Lithuania | 100.0 /100 | #14 | Exceptional 1.9% |
| Immigrants | Eastern Asia | 100.0 /100 | #15 | Exceptional 1.9% |
| Immigrants | Iran | 100.0 /100 | #16 | Exceptional 1.9% |
| Immigrants | India | 100.0 /100 | #17 | Exceptional 1.9% |
| Indians (Asian) | 100.0 /100 | #18 | Exceptional 1.9% |
| Iranians | 100.0 /100 | #19 | Exceptional 1.9% |
Demographics Similar to French American Indians by Single Father Households
In terms of single father households, the demographic groups most similar to French American Indians are Immigrants from Micronesia (2.6%, a difference of 0.040%), Indonesian (2.6%, a difference of 0.10%), Guamanian/Chamorro (2.6%, a difference of 0.48%), Haitian (2.6%, a difference of 0.52%), and Dominican (2.5%, a difference of 0.79%).
| Demographics | Rating | Rank | Single Father Households |
| Comanche | 1.0 /100 | #259 | Tragic 2.5% |
| Immigrants | Caribbean | 1.0 /100 | #260 | Tragic 2.5% |
| Immigrants | Belize | 0.9 /100 | #261 | Tragic 2.5% |
| Immigrants | Liberia | 0.8 /100 | #262 | Tragic 2.5% |
| Dominicans | 0.8 /100 | #263 | Tragic 2.5% |
| Indonesians | 0.5 /100 | #264 | Tragic 2.6% |
| Immigrants | Micronesia | 0.5 /100 | #265 | Tragic 2.6% |
| French American Indians | 0.5 /100 | #266 | Tragic 2.6% |
| Guamanians/Chamorros | 0.4 /100 | #267 | Tragic 2.6% |
| Haitians | 0.4 /100 | #268 | Tragic 2.6% |
| Cubans | 0.3 /100 | #269 | Tragic 2.6% |
| Seminole | 0.3 /100 | #270 | Tragic 2.6% |
| Creek | 0.2 /100 | #271 | Tragic 2.6% |
| Belizeans | 0.2 /100 | #272 | Tragic 2.6% |
| Iroquois | 0.2 /100 | #273 | Tragic 2.6% |