Immigrants from Ghana vs Immigrants from Vietnam Divorced or Separated
COMPARE
Immigrants from Ghana
Immigrants from Vietnam
Divorced or Separated
Divorced or Separated Comparison
Immigrants from Ghana
Immigrants from Vietnam
12.2%
DIVORCED OR SEPARATED
18.8/ 100
METRIC RATING
208th/ 347
METRIC RANK
11.3%
DIVORCED OR SEPARATED
99.9/ 100
METRIC RATING
57th/ 347
METRIC RANK
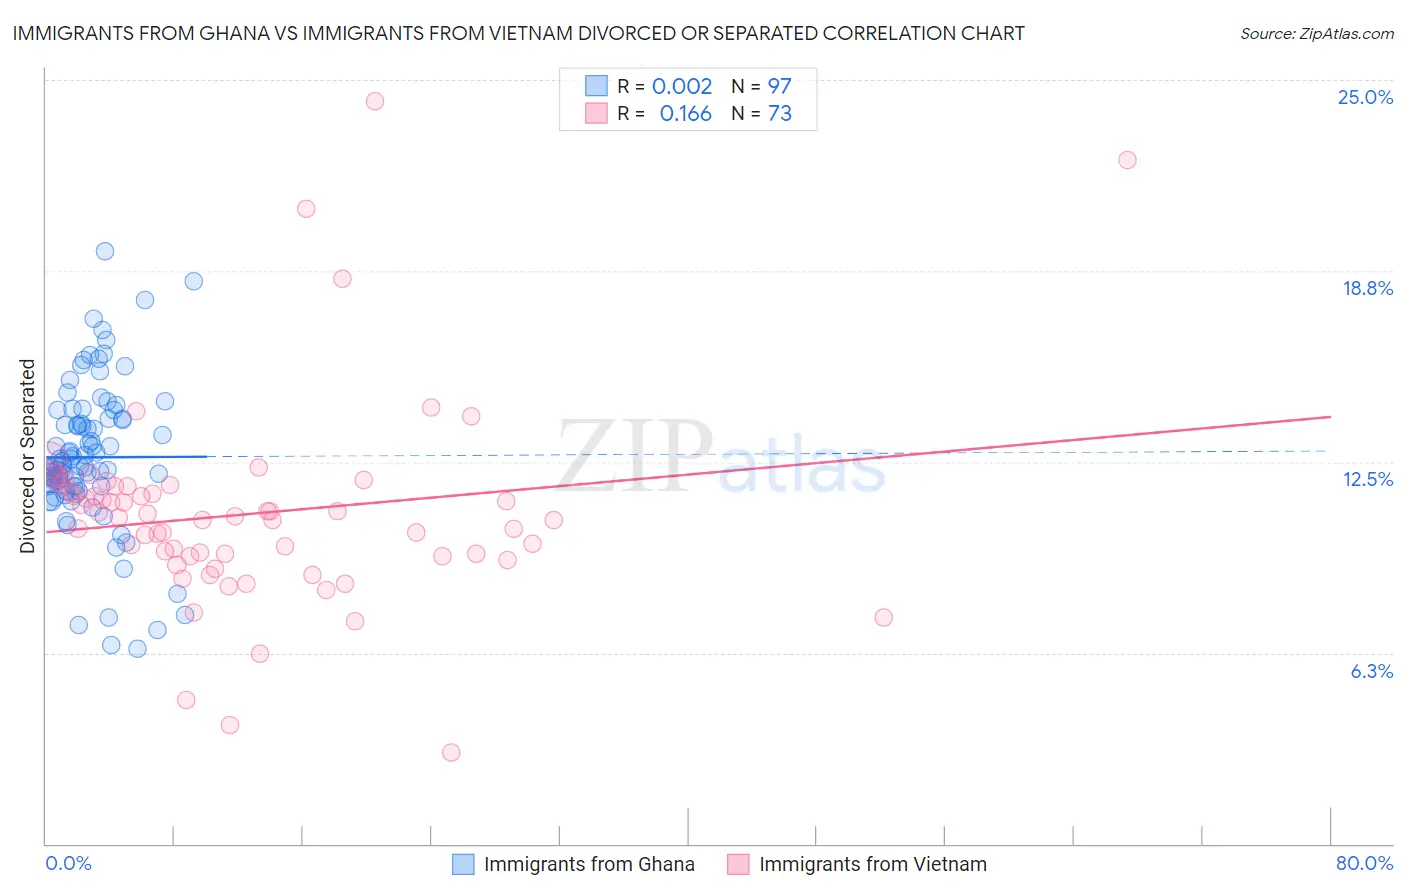
Immigrants from Ghana vs Immigrants from Vietnam Divorced or Separated Correlation Chart
The statistical analysis conducted on geographies consisting of 199,867,447 people shows no correlation between the proportion of Immigrants from Ghana and percentage of population currently divorced or separated in the United States with a correlation coefficient (R) of 0.002 and weighted average of 12.2%. Similarly, the statistical analysis conducted on geographies consisting of 404,667,518 people shows a poor positive correlation between the proportion of Immigrants from Vietnam and percentage of population currently divorced or separated in the United States with a correlation coefficient (R) of 0.166 and weighted average of 11.3%, a difference of 7.9%.
Divorced or Separated Correlation Summary
| Measurement | Immigrants from Ghana | Immigrants from Vietnam |
| Minimum | 6.4% | 3.0% |
| Maximum | 19.4% | 24.3% |
| Range | 13.0% | 21.3% |
| Mean | 12.7% | 10.8% |
| Median | 12.4% | 10.7% |
| Interquartile 25% (IQ1) | 11.7% | 9.4% |
| Interquartile 75% (IQ3) | 13.9% | 11.7% |
| Interquartile Range (IQR) | 2.2% | 2.3% |
| Standard Deviation (Sample) | 2.4% | 3.3% |
| Standard Deviation (Population) | 2.4% | 3.3% |
Similar Demographics by Divorced or Separated
Demographics Similar to Immigrants from Ghana by Divorced or Separated
In terms of divorced or separated, the demographic groups most similar to Immigrants from Ghana are Immigrants from Trinidad and Tobago (12.2%, a difference of 0.050%), Slavic (12.2%, a difference of 0.11%), Slovak (12.2%, a difference of 0.12%), Mexican (12.2%, a difference of 0.12%), and Immigrants from Costa Rica (12.2%, a difference of 0.13%).
| Demographics | Rating | Rank | Divorced or Separated |
| Guatemalans | 26.9 /100 | #201 | Fair 12.2% |
| Portuguese | 23.5 /100 | #202 | Fair 12.2% |
| Immigrants | Guatemala | 23.2 /100 | #203 | Fair 12.2% |
| Kenyans | 21.8 /100 | #204 | Fair 12.2% |
| Immigrants | Costa Rica | 21.3 /100 | #205 | Fair 12.2% |
| Slovaks | 21.0 /100 | #206 | Fair 12.2% |
| Mexicans | 21.0 /100 | #207 | Fair 12.2% |
| Immigrants | Ghana | 18.8 /100 | #208 | Poor 12.2% |
| Immigrants | Trinidad and Tobago | 17.8 /100 | #209 | Poor 12.2% |
| Slavs | 17.0 /100 | #210 | Poor 12.2% |
| Trinidadians and Tobagonians | 16.6 /100 | #211 | Poor 12.2% |
| Immigrants | Kenya | 16.5 /100 | #212 | Poor 12.2% |
| Immigrants | Eastern Africa | 16.2 /100 | #213 | Poor 12.2% |
| Immigrants | Argentina | 15.5 /100 | #214 | Poor 12.2% |
| Europeans | 15.4 /100 | #215 | Poor 12.2% |
Demographics Similar to Immigrants from Vietnam by Divorced or Separated
In terms of divorced or separated, the demographic groups most similar to Immigrants from Vietnam are Immigrants from Philippines (11.3%, a difference of 0.010%), Sri Lankan (11.3%, a difference of 0.060%), Immigrants from Yemen (11.3%, a difference of 0.070%), Eastern European (11.3%, a difference of 0.080%), and Israeli (11.3%, a difference of 0.16%).
| Demographics | Rating | Rank | Divorced or Separated |
| Bolivians | 100.0 /100 | #50 | Exceptional 11.2% |
| Immigrants | Bolivia | 100.0 /100 | #51 | Exceptional 11.3% |
| Immigrants | Australia | 99.9 /100 | #52 | Exceptional 11.3% |
| Immigrants | Lithuania | 99.9 /100 | #53 | Exceptional 11.3% |
| Eastern Europeans | 99.9 /100 | #54 | Exceptional 11.3% |
| Immigrants | Yemen | 99.9 /100 | #55 | Exceptional 11.3% |
| Immigrants | Philippines | 99.9 /100 | #56 | Exceptional 11.3% |
| Immigrants | Vietnam | 99.9 /100 | #57 | Exceptional 11.3% |
| Sri Lankans | 99.9 /100 | #58 | Exceptional 11.3% |
| Israelis | 99.9 /100 | #59 | Exceptional 11.3% |
| Immigrants | Russia | 99.9 /100 | #60 | Exceptional 11.3% |
| Koreans | 99.9 /100 | #61 | Exceptional 11.3% |
| Luxembourgers | 99.9 /100 | #62 | Exceptional 11.3% |
| Immigrants | Kuwait | 99.9 /100 | #63 | Exceptional 11.3% |
| Macedonians | 99.8 /100 | #64 | Exceptional 11.4% |