Immigrants from France vs Guatemalan Average Family Size

COMPARE

Immigrants from France
Race
Ancestry
AfghanAfricanAlaska NativeAlaskan AthabascanAlbanianAleutAlsatianAmericanApacheArabArapahoArgentineanArmenianAssyrian/Chaldean/SyriacAustralianAustrianBahamianBangladeshiBarbadianBasqueBelgianBelizeanBermudanBhutaneseBlackfeetBolivianBrazilianBritishBritish West IndianBulgarianBurmeseCajunCambodianCanadianCape VerdeanCarpatho RusynCelticCentral AmericanCentral American IndianCherokeeCheyenneChickasawChileanChineseChippewaChoctawColombianColvilleComancheCosta RicanCreeCreekCroatianCrowCubanCypriotCzechCzechoslovakianDanishDelawareDominicanDutchDutch West IndianEastern EuropeanEcuadorianEgyptianEnglishEstonianEthiopianEuropeanFijianFilipinoFinnishFrenchFrench American IndianFrench CanadianGermanGerman RussianGhanaianGreekGuamanian/ChamorroGuyaneseHaitianHmongHonduranHopiHoumaHungarianIcelanderIndian (Asian)IndonesianInupiatIranianIraqiIrishIroquoisIsraeliItalianJamaicanJapaneseJordanianKenyanKiowaKoreanLaotianLatvianLebaneseLiberianLithuanianLumbeeLuxembourgerMacedonianMalaysianMalteseMarshalleseMenomineeMexicanMexican American IndianMongolianMoroccanNative HawaiianNavajoNepaleseNew ZealanderNicaraguanNigerianNorthern EuropeanNorwegianOkinawanOsageOttawaPaiutePakistaniPalestinianPanamanianParaguayanPennsylvania GermanPeruvianPimaPolishPortuguesePotawatomiPuebloPuerto RicanPuget Sound SalishRomanianRussianSalvadoranSamoanScandinavianScotch-IrishScottishSeminoleSenegaleseSerbianShoshoneSierra LeoneanSiouxSlavicSlovakSloveneSomaliSouth AfricanSouth AmericanSouth American IndianSoviet UnionSpaniardSpanishSpanish AmericanSpanish American IndianSri LankanSubsaharan AfricanSudaneseSwedishSwissSyrianTaiwaneseThaiTlingit-HaidaTohono O'OdhamTonganTrinidadian and TobagonianTsimshianTurkishU.S. Virgin IslanderUgandanUkrainianUruguayanUteVenezuelanVietnameseWelshWest IndianYakamaYaquiYugoslavianYumanYup'ikZimbabwean
Immigration
NonimmigrantsImmigrantsAfghanistanAfricaAlbaniaArgentinaArmeniaAsiaAustraliaAustriaBahamasBangladeshBarbadosBelarusBelgiumBelizeBoliviaBosnia and HerzegovinaBrazilBulgariaBurma/MyanmarCabo VerdeCambodiaCameroonCanadaCaribbeanCentral AmericaChileChinaColombiaCongoCosta RicaCroatiaCubaCzechoslovakiaDenmarkDominicaDominican RepublicEastern AfricaEastern AsiaEastern EuropeEcuadorEgyptEl SalvadorEnglandEritreaEthiopiaEuropeFijiFranceGermanyGhanaGreeceGrenadaGuatemalaGuyanaHaitiHondurasHong KongHungaryIndiaIndonesiaIranIraqIrelandIsraelItalyJamaicaJapanJordanKazakhstanKenyaKoreaKuwaitLaosLatin AmericaLatviaLebanonLiberiaLithuaniaMalaysiaMexicoMicronesiaMiddle AfricaMoldovaMoroccoNepalNetherlandsNicaraguaNigeriaNorth AmericaNorth MacedoniaNorthern AfricaNorthern EuropeNorwayOceaniaPakistanPanamaPeruPhilippinesPolandPortugalRomaniaRussiaSaudi ArabiaScotlandSenegalSerbiaSierra LeoneSingaporeSomaliaSouth AfricaSouth AmericaSouth Central AsiaSouth Eastern AsiaSouthern EuropeSpainSri LankaSt. Vincent and the GrenadinesSudanSwedenSwitzerlandSyriaTaiwanThailandTrinidad and TobagoTurkeyUgandaUkraineUruguayUzbekistanVenezuelaVietnamWest IndiesWestern AfricaWestern AsiaWestern EuropeYemenZaireZimbabweAzores
Guatemalan
Race
Ancestry
AfghanAfricanAlaska NativeAlaskan AthabascanAlbanianAleutAlsatianAmericanApacheArabArapahoArgentineanArmenianAssyrian/Chaldean/SyriacAustralianAustrianBahamianBangladeshiBarbadianBasqueBelgianBelizeanBermudanBhutaneseBlackfeetBolivianBrazilianBritishBritish West IndianBulgarianBurmeseCajunCambodianCanadianCape VerdeanCarpatho RusynCelticCentral AmericanCentral American IndianCherokeeCheyenneChickasawChileanChineseChippewaChoctawColombianColvilleComancheCosta RicanCreeCreekCroatianCrowCubanCypriotCzechCzechoslovakianDanishDelawareDominicanDutchDutch West IndianEastern EuropeanEcuadorianEgyptianEnglishEstonianEthiopianEuropeanFijianFilipinoFinnishFrenchFrench American IndianFrench CanadianGermanGerman RussianGhanaianGreekGuamanian/ChamorroGuatemalanGuyaneseHaitianHmongHonduranHopiHoumaHungarianIcelanderIndian (Asian)IndonesianInupiatIranianIraqiIrishIroquoisIsraeliItalianJamaicanJapaneseJordanianKenyanKiowaKoreanLaotianLatvianLebaneseLiberianLithuanianLumbeeLuxembourgerMacedonianMalaysianMalteseMarshalleseMenomineeMexicanMexican American IndianMongolianMoroccanNative HawaiianNavajoNepaleseNew ZealanderNicaraguanNigerianNorthern EuropeanNorwegianOkinawanOsageOttawaPaiutePakistaniPalestinianPanamanianParaguayanPennsylvania GermanPeruvianPimaPolishPortuguesePotawatomiPuebloPuerto RicanPuget Sound SalishRomanianRussianSalvadoranSamoanScandinavianScotch-IrishScottishSeminoleSenegaleseSerbianShoshoneSierra LeoneanSiouxSlavicSlovakSloveneSomaliSouth AfricanSouth AmericanSouth American IndianSoviet UnionSpaniardSpanishSpanish AmericanSpanish American IndianSri LankanSubsaharan AfricanSudaneseSwedishSwissSyrianTaiwaneseThaiTlingit-HaidaTohono O'OdhamTonganTrinidadian and TobagonianTsimshianTurkishU.S. Virgin IslanderUgandanUkrainianUruguayanUteVenezuelanVietnameseWelshWest IndianYakamaYaquiYugoslavianYumanYup'ikZimbabwean
Immigration
NonimmigrantsImmigrantsAfghanistanAfricaAlbaniaArgentinaArmeniaAsiaAustraliaAustriaBahamasBangladeshBarbadosBelarusBelgiumBelizeBoliviaBosnia and HerzegovinaBrazilBulgariaBurma/MyanmarCabo VerdeCambodiaCameroonCanadaCaribbeanCentral AmericaChileChinaColombiaCongoCosta RicaCroatiaCubaCzechoslovakiaDenmarkDominicaDominican RepublicEastern AfricaEastern AsiaEastern EuropeEcuadorEgyptEl SalvadorEnglandEritreaEthiopiaEuropeFijiGermanyGhanaGreeceGrenadaGuatemalaGuyanaHaitiHondurasHong KongHungaryIndiaIndonesiaIranIraqIrelandIsraelItalyJamaicaJapanJordanKazakhstanKenyaKoreaKuwaitLaosLatin AmericaLatviaLebanonLiberiaLithuaniaMalaysiaMexicoMicronesiaMiddle AfricaMoldovaMoroccoNepalNetherlandsNicaraguaNigeriaNorth AmericaNorth MacedoniaNorthern AfricaNorthern EuropeNorwayOceaniaPakistanPanamaPeruPhilippinesPolandPortugalRomaniaRussiaSaudi ArabiaScotlandSenegalSerbiaSierra LeoneSingaporeSomaliaSouth AfricaSouth AmericaSouth Central AsiaSouth Eastern AsiaSouthern EuropeSpainSri LankaSt. Vincent and the GrenadinesSudanSwedenSwitzerlandSyriaTaiwanThailandTrinidad and TobagoTurkeyUgandaUkraineUruguayUzbekistanVenezuelaVietnamWest IndiesWestern AfricaWestern AsiaWestern EuropeYemenZaireZimbabweAzores
Average Family Size
Income
Poverty
Unemployment
Labor Participation
Family Structure
Vehicle Availability
Education Level
Disability

Average Family Size Comparison

Immigrants from France

Guatemalans

Tragic
Exceptional
3.15
AVERAGE FAMILY SIZE
0.4/ 100
METRIC RATING
284th/ 347
METRIC RANK
3.40
AVERAGE FAMILY SIZE
100.0/ 100
METRIC RATING
35th/ 347
METRIC RANK

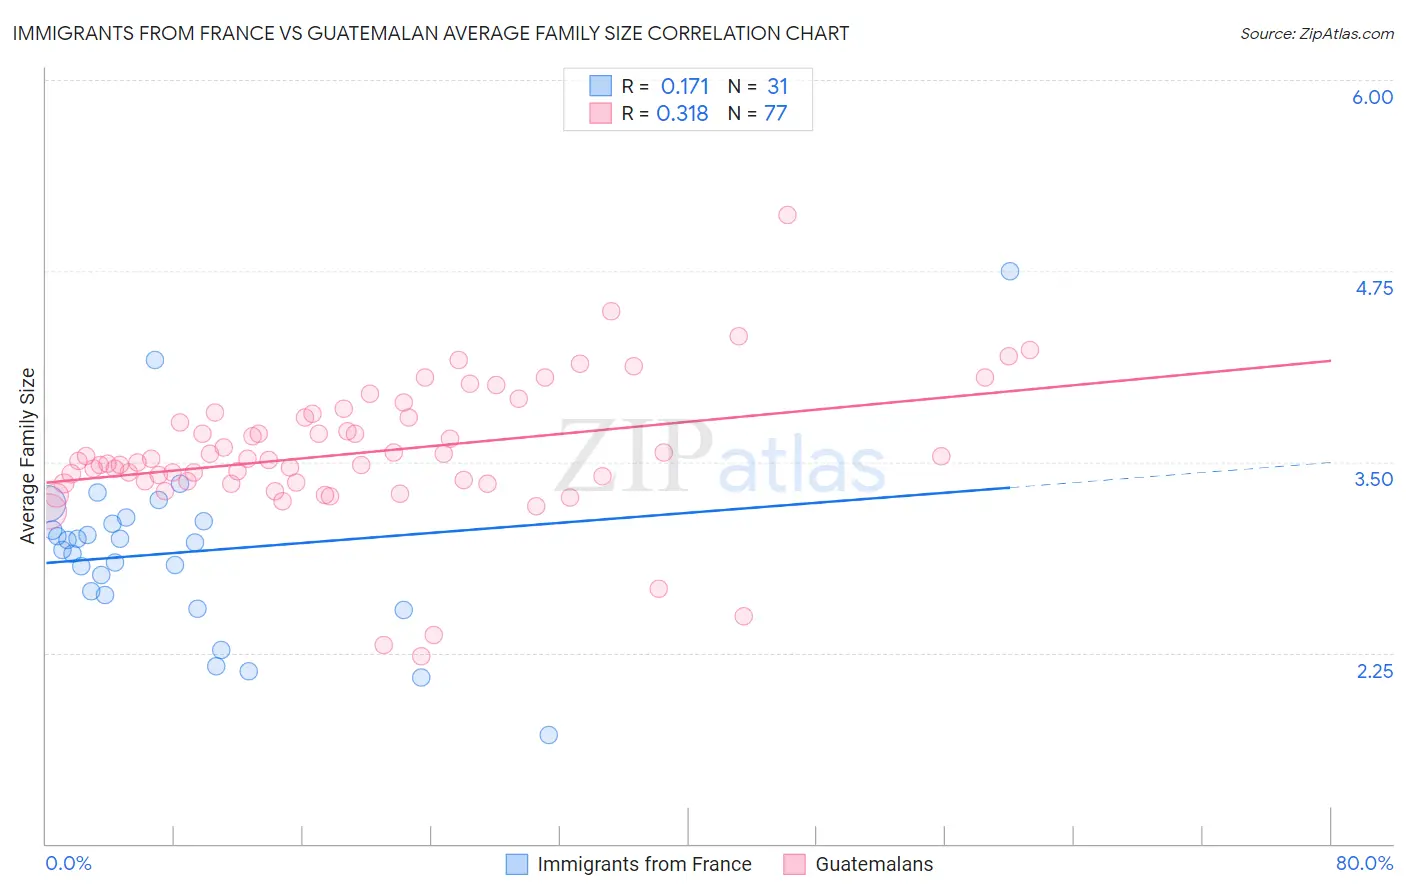
Immigrants from France vs Guatemalan Average Family Size Correlation Chart

The statistical analysis conducted on geographies consisting of 287,855,925 people shows a poor positive correlation between the proportion of Immigrants from France and average family size in the United States with a correlation coefficient (R) of 0.171 and weighted average of 3.15. Similarly, the statistical analysis conducted on geographies consisting of 409,298,058 people shows a mild positive correlation between the proportion of Guatemalans and average family size in the United States with a correlation coefficient (R) of 0.318 and weighted average of 3.40, a difference of 8.2%.
Immigrants from France vs Guatemalan Average Family Size

Average Family Size Correlation Summary

MeasurementImmigrants from FranceGuatemalan
Minimum1.712.22
Maximum4.755.12
Range3.042.90
Mean2.913.56
Median2.973.51
Interquartile 25% (IQ1)2.633.37
Interquartile 75% (IQ3)3.113.80
Interquartile Range (IQR)0.480.44
Standard Deviation (Sample)0.570.46
Standard Deviation (Population)0.570.45

Similar Demographics by Average Family Size

Demographics Similar to Immigrants from France by Average Family Size

In terms of average family size, the demographic groups most similar to Immigrants from France are German Russian (3.15, a difference of 0.020%), Yugoslavian (3.15, a difference of 0.030%), Immigrants from Denmark (3.15, a difference of 0.040%), White/Caucasian (3.14, a difference of 0.050%), and Immigrants from England (3.15, a difference of 0.070%).
DemographicsRating | RankAverage Family Size
Swiss
0.5
/100
|
#277
Tragic
3.15
Okinawans
0.5
/100
|
#278
Tragic
3.15
Immigrants | Europe
0.5
/100
|
#279
Tragic
3.15
Immigrants | England
0.4
/100
|
#280
Tragic
3.15
Immigrants | Denmark
0.4
/100
|
#281
Tragic
3.15
Yugoslavians
0.4
/100
|
#282
Tragic
3.15
German Russians
0.4
/100
|
#283
Tragic
3.15
Immigrants | France
0.4
/100
|
#284
Tragic
3.15
Whites/Caucasians
0.3
/100
|
#285
Tragic
3.14
Immigrants | Netherlands
0.3
/100
|
#286
Tragic
3.14
Greeks
0.3
/100
|
#287
Tragic
3.14
Immigrants | Czechoslovakia
0.3
/100
|
#288
Tragic
3.14
Immigrants | Norway
0.3
/100
|
#289
Tragic
3.14
Cypriots
0.3
/100
|
#290
Tragic
3.14
Alsatians
0.2
/100
|
#291
Tragic
3.14

Demographics Similar to Guatemalans by Average Family Size

In terms of average family size, the demographic groups most similar to Guatemalans are Immigrants from Guyana (3.40, a difference of 0.050%), Hispanic or Latino (3.41, a difference of 0.060%), Hawaiian (3.41, a difference of 0.12%), Immigrants from Guatemala (3.41, a difference of 0.14%), and Guyanese (3.40, a difference of 0.19%).
DemographicsRating | RankAverage Family Size
Immigrants | Latin America
100.0
/100
|
#28
Exceptional
3.42
Nepalese
100.0
/100
|
#29
Exceptional
3.42
Samoans
100.0
/100
|
#30
Exceptional
3.42
Central Americans
100.0
/100
|
#31
Exceptional
3.41
Immigrants | Guatemala
100.0
/100
|
#32
Exceptional
3.41
Hawaiians
100.0
/100
|
#33
Exceptional
3.41
Hispanics or Latinos
100.0
/100
|
#34
Exceptional
3.41
Guatemalans
100.0
/100
|
#35
Exceptional
3.40
Immigrants | Guyana
100.0
/100
|
#36
Exceptional
3.40
Guyanese
100.0
/100
|
#37
Exceptional
3.40
Immigrants | Belize
100.0
/100
|
#38
Exceptional
3.39
Immigrants | Haiti
100.0
/100
|
#39
Exceptional
3.39
Belizeans
100.0
/100
|
#40
Exceptional
3.39
Marshallese
100.0
/100
|
#41
Exceptional
3.38
Immigrants | Vietnam
100.0
/100
|
#42
Exceptional
3.38