Immigrants from Fiji vs Immigrants from Vietnam Average Family Size
COMPARE
Immigrants from Fiji
Immigrants from Vietnam
Average Family Size
Average Family Size Comparison
Immigrants from Fiji
Immigrants from Vietnam
3.45
AVERAGE FAMILY SIZE
100.0/ 100
METRIC RATING
23rd/ 347
METRIC RANK
3.38
AVERAGE FAMILY SIZE
100.0/ 100
METRIC RATING
42nd/ 347
METRIC RANK
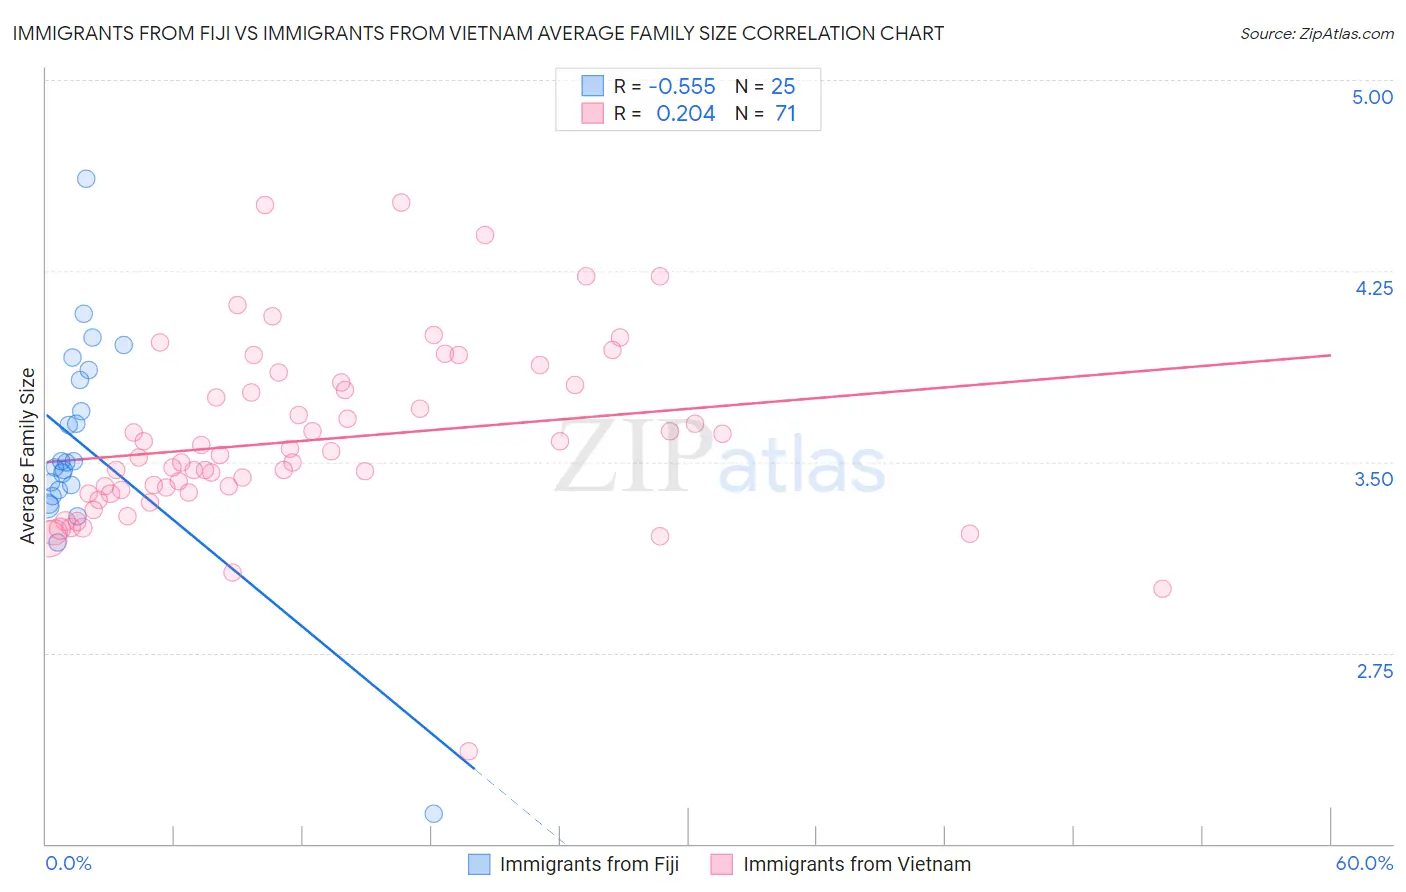
Immigrants from Fiji vs Immigrants from Vietnam Average Family Size Correlation Chart
The statistical analysis conducted on geographies consisting of 93,754,900 people shows a substantial negative correlation between the proportion of Immigrants from Fiji and average family size in the United States with a correlation coefficient (R) of -0.555 and weighted average of 3.45. Similarly, the statistical analysis conducted on geographies consisting of 404,558,006 people shows a weak positive correlation between the proportion of Immigrants from Vietnam and average family size in the United States with a correlation coefficient (R) of 0.204 and weighted average of 3.38, a difference of 2.2%.
Average Family Size Correlation Summary
| Measurement | Immigrants from Fiji | Immigrants from Vietnam |
| Minimum | 2.12 | 2.36 |
| Maximum | 4.61 | 4.52 |
| Range | 2.49 | 2.16 |
| Mean | 3.56 | 3.58 |
| Median | 3.50 | 3.52 |
| Interquartile 25% (IQ1) | 3.38 | 3.38 |
| Interquartile 75% (IQ3) | 3.84 | 3.80 |
| Interquartile Range (IQR) | 0.46 | 0.42 |
| Standard Deviation (Sample) | 0.44 | 0.36 |
| Standard Deviation (Population) | 0.43 | 0.36 |
Demographics Similar to Immigrants from Fiji and Immigrants from Vietnam by Average Family Size
In terms of average family size, the demographic groups most similar to Immigrants from Fiji are Native/Alaskan (3.45, a difference of 0.12%), Yakama (3.45, a difference of 0.23%), Apache (3.46, a difference of 0.29%), Native Hawaiian (3.43, a difference of 0.74%), and Mexican American Indian (3.43, a difference of 0.75%). Similarly, the demographic groups most similar to Immigrants from Vietnam are Marshallese (3.38, a difference of 0.060%), Belizean (3.39, a difference of 0.23%), Immigrants from Haiti (3.39, a difference of 0.35%), Immigrants from Belize (3.39, a difference of 0.43%), and Guyanese (3.40, a difference of 0.59%).
| Demographics | Rating | Rank | Average Family Size |
| Apache | 100.0 /100 | #22 | Exceptional 3.46 |
| Immigrants | Fiji | 100.0 /100 | #23 | Exceptional 3.45 |
| Natives/Alaskans | 100.0 /100 | #24 | Exceptional 3.45 |
| Yakama | 100.0 /100 | #25 | Exceptional 3.45 |
| Native Hawaiians | 100.0 /100 | #26 | Exceptional 3.43 |
| Mexican American Indians | 100.0 /100 | #27 | Exceptional 3.43 |
| Immigrants | Latin America | 100.0 /100 | #28 | Exceptional 3.42 |
| Nepalese | 100.0 /100 | #29 | Exceptional 3.42 |
| Samoans | 100.0 /100 | #30 | Exceptional 3.42 |
| Central Americans | 100.0 /100 | #31 | Exceptional 3.41 |
| Immigrants | Guatemala | 100.0 /100 | #32 | Exceptional 3.41 |
| Hawaiians | 100.0 /100 | #33 | Exceptional 3.41 |
| Hispanics or Latinos | 100.0 /100 | #34 | Exceptional 3.41 |
| Guatemalans | 100.0 /100 | #35 | Exceptional 3.40 |
| Immigrants | Guyana | 100.0 /100 | #36 | Exceptional 3.40 |
| Guyanese | 100.0 /100 | #37 | Exceptional 3.40 |
| Immigrants | Belize | 100.0 /100 | #38 | Exceptional 3.39 |
| Immigrants | Haiti | 100.0 /100 | #39 | Exceptional 3.39 |
| Belizeans | 100.0 /100 | #40 | Exceptional 3.39 |
| Marshallese | 100.0 /100 | #41 | Exceptional 3.38 |
| Immigrants | Vietnam | 100.0 /100 | #42 | Exceptional 3.38 |