Immigrants from Eritrea vs Korean Currently Married
COMPARE
Immigrants from Eritrea
Korean
Currently Married
Currently Married Comparison
Immigrants from Eritrea
Koreans
43.6%
CURRENTLY MARRIED
0.1/ 100
METRIC RATING
267th/ 347
METRIC RANK
47.9%
CURRENTLY MARRIED
95.4/ 100
METRIC RATING
92nd/ 347
METRIC RANK
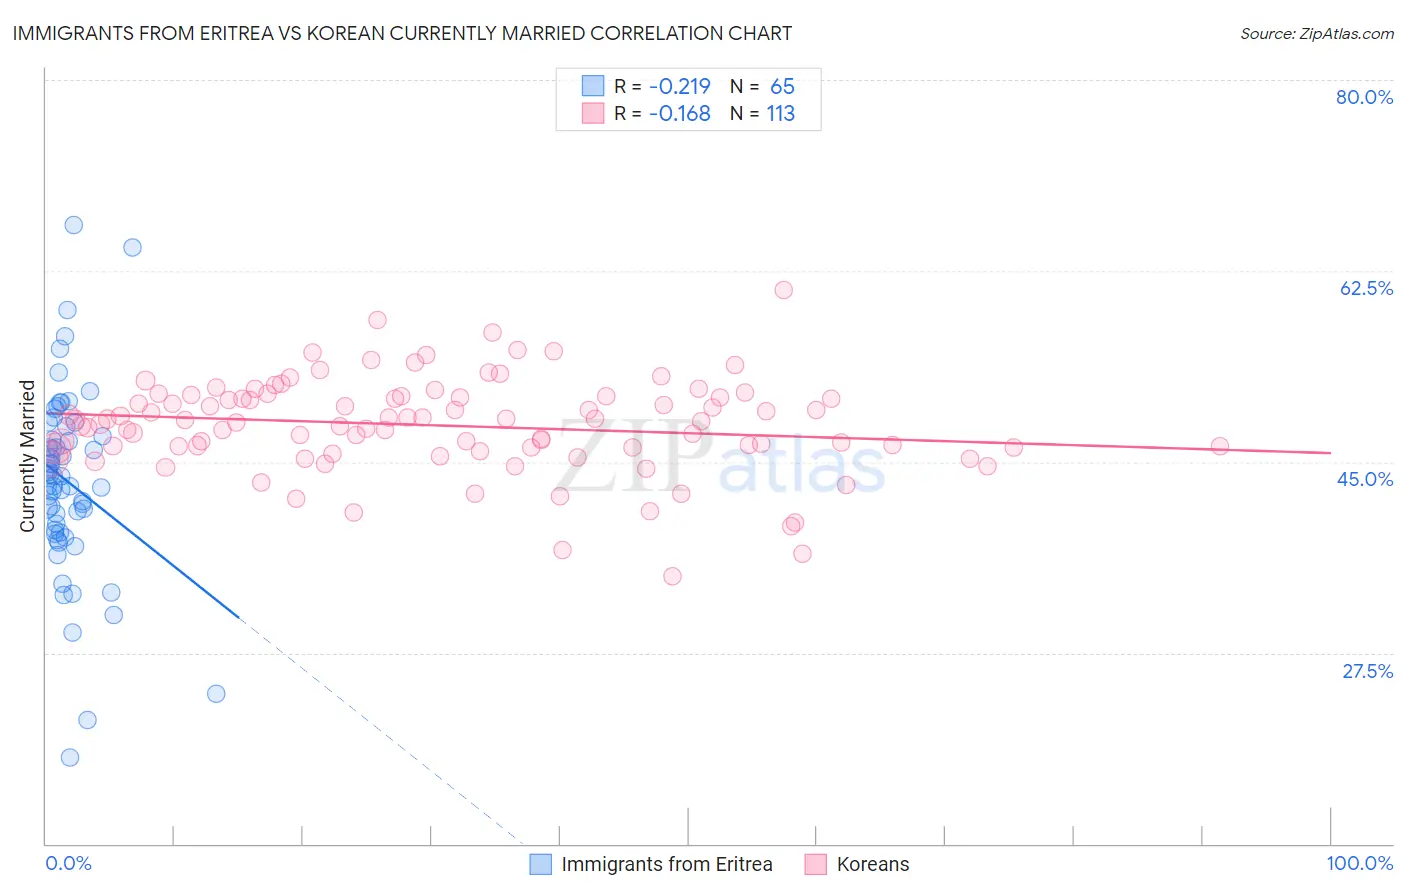
Immigrants from Eritrea vs Korean Currently Married Correlation Chart
The statistical analysis conducted on geographies consisting of 104,847,164 people shows a weak negative correlation between the proportion of Immigrants from Eritrea and percentage of population currently married in the United States with a correlation coefficient (R) of -0.219 and weighted average of 43.6%. Similarly, the statistical analysis conducted on geographies consisting of 510,845,444 people shows a poor negative correlation between the proportion of Koreans and percentage of population currently married in the United States with a correlation coefficient (R) of -0.168 and weighted average of 47.9%, a difference of 10.0%.
Currently Married Correlation Summary
| Measurement | Immigrants from Eritrea | Korean |
| Minimum | 17.9% | 34.5% |
| Maximum | 66.7% | 60.8% |
| Range | 48.8% | 26.3% |
| Mean | 43.2% | 48.3% |
| Median | 43.6% | 48.7% |
| Interquartile 25% (IQ1) | 38.6% | 46.3% |
| Interquartile 75% (IQ3) | 47.8% | 50.9% |
| Interquartile Range (IQR) | 9.2% | 4.7% |
| Standard Deviation (Sample) | 8.6% | 4.3% |
| Standard Deviation (Population) | 8.6% | 4.3% |
Similar Demographics by Currently Married
Demographics Similar to Immigrants from Eritrea by Currently Married
In terms of currently married, the demographic groups most similar to Immigrants from Eritrea are Spanish American Indian (43.6%, a difference of 0.0%), Ecuadorian (43.6%, a difference of 0.030%), Immigrants from Bangladesh (43.6%, a difference of 0.10%), Immigrants from Sudan (43.5%, a difference of 0.13%), and Sudanese (43.7%, a difference of 0.18%).
| Demographics | Rating | Rank | Currently Married |
| Immigrants | Latin America | 0.1 /100 | #260 | Tragic 43.8% |
| Immigrants | Nicaragua | 0.1 /100 | #261 | Tragic 43.7% |
| Bangladeshis | 0.1 /100 | #262 | Tragic 43.7% |
| Immigrants | Cuba | 0.1 /100 | #263 | Tragic 43.7% |
| Sudanese | 0.1 /100 | #264 | Tragic 43.7% |
| Immigrants | Bangladesh | 0.1 /100 | #265 | Tragic 43.6% |
| Ecuadorians | 0.1 /100 | #266 | Tragic 43.6% |
| Immigrants | Eritrea | 0.1 /100 | #267 | Tragic 43.6% |
| Spanish American Indians | 0.1 /100 | #268 | Tragic 43.6% |
| Immigrants | Sudan | 0.1 /100 | #269 | Tragic 43.5% |
| Salvadorans | 0.1 /100 | #270 | Tragic 43.5% |
| Bermudans | 0.1 /100 | #271 | Tragic 43.5% |
| Indonesians | 0.1 /100 | #272 | Tragic 43.5% |
| Yaqui | 0.1 /100 | #273 | Tragic 43.4% |
| Nigerians | 0.1 /100 | #274 | Tragic 43.4% |
Demographics Similar to Koreans by Currently Married
In terms of currently married, the demographic groups most similar to Koreans are Immigrants from Bolivia (47.9%, a difference of 0.040%), Lebanese (47.9%, a difference of 0.050%), American (48.0%, a difference of 0.070%), Native Hawaiian (47.9%, a difference of 0.070%), and Indian (Asian) (48.0%, a difference of 0.090%).
| Demographics | Rating | Rank | Currently Married |
| French Canadians | 96.3 /100 | #85 | Exceptional 48.0% |
| Immigrants | Japan | 96.2 /100 | #86 | Exceptional 48.0% |
| Jordanians | 96.2 /100 | #87 | Exceptional 48.0% |
| Immigrants | Eastern Europe | 96.1 /100 | #88 | Exceptional 48.0% |
| Indians (Asian) | 95.8 /100 | #89 | Exceptional 48.0% |
| Americans | 95.7 /100 | #90 | Exceptional 48.0% |
| Immigrants | Bolivia | 95.6 /100 | #91 | Exceptional 47.9% |
| Koreans | 95.4 /100 | #92 | Exceptional 47.9% |
| Lebanese | 95.1 /100 | #93 | Exceptional 47.9% |
| Native Hawaiians | 95.0 /100 | #94 | Exceptional 47.9% |
| Immigrants | Bulgaria | 94.8 /100 | #95 | Exceptional 47.9% |
| Egyptians | 94.8 /100 | #96 | Exceptional 47.9% |
| Immigrants | Ukraine | 94.8 /100 | #97 | Exceptional 47.9% |
| Immigrants | China | 94.7 /100 | #98 | Exceptional 47.9% |
| Immigrants | Sweden | 94.3 /100 | #99 | Exceptional 47.8% |