Immigrants from England vs Immigrants from Jamaica Family Households with Children
COMPARE
Immigrants from England
Immigrants from Jamaica
Family Households with Children
Family Households with Children Comparison
Immigrants from England
Immigrants from Jamaica
26.9%
FAMILY HOUSEHOLDS WITH CHILDREN
3.2/ 100
METRIC RATING
242nd/ 347
METRIC RANK
26.8%
FAMILY HOUSEHOLDS WITH CHILDREN
1.2/ 100
METRIC RATING
260th/ 347
METRIC RANK
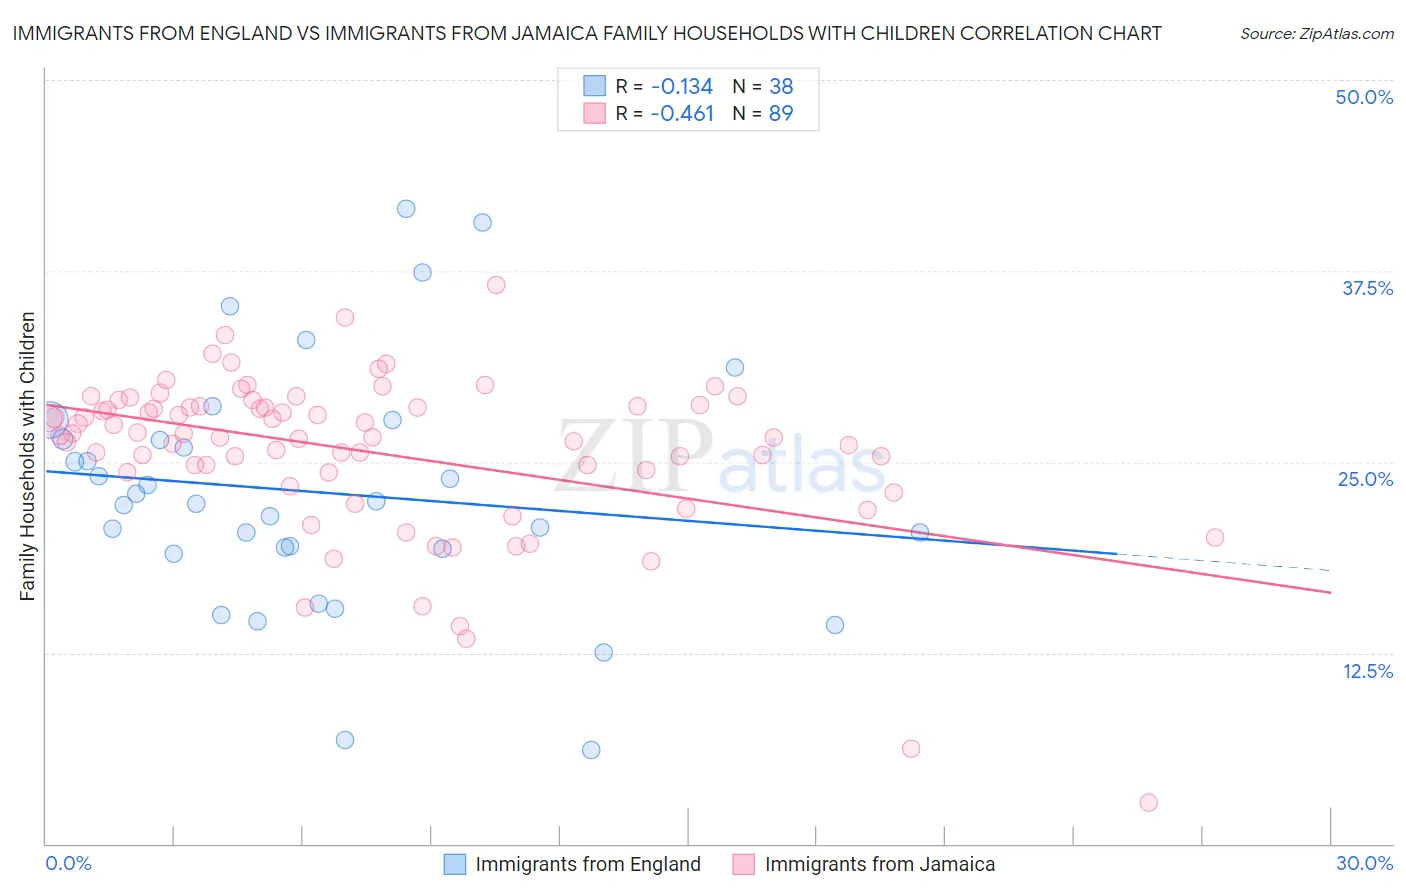
Immigrants from England vs Immigrants from Jamaica Family Households with Children Correlation Chart
The statistical analysis conducted on geographies consisting of 391,583,092 people shows a poor negative correlation between the proportion of Immigrants from England and percentage of family households with children in the United States with a correlation coefficient (R) of -0.134 and weighted average of 26.9%. Similarly, the statistical analysis conducted on geographies consisting of 301,520,454 people shows a moderate negative correlation between the proportion of Immigrants from Jamaica and percentage of family households with children in the United States with a correlation coefficient (R) of -0.461 and weighted average of 26.8%, a difference of 0.57%.
Family Households with Children Correlation Summary
| Measurement | Immigrants from England | Immigrants from Jamaica |
| Minimum | 6.1% | 2.7% |
| Maximum | 41.6% | 36.6% |
| Range | 35.4% | 33.9% |
| Mean | 23.0% | 25.6% |
| Median | 22.3% | 26.7% |
| Interquartile 25% (IQ1) | 19.3% | 24.3% |
| Interquartile 75% (IQ3) | 26.5% | 28.6% |
| Interquartile Range (IQR) | 7.2% | 4.3% |
| Standard Deviation (Sample) | 8.0% | 5.4% |
| Standard Deviation (Population) | 7.9% | 5.4% |
Demographics Similar to Immigrants from England and Immigrants from Jamaica by Family Households with Children
In terms of family households with children, the demographic groups most similar to Immigrants from England are Navajo (26.9%, a difference of 0.0%), Immigrants from Saudi Arabia (26.9%, a difference of 0.060%), Ukrainian (26.9%, a difference of 0.070%), Australian (26.9%, a difference of 0.090%), and Jamaican (26.9%, a difference of 0.16%). Similarly, the demographic groups most similar to Immigrants from Jamaica are Immigrants from Lithuania (26.8%, a difference of 0.020%), Slavic (26.8%, a difference of 0.050%), Immigrants from Cuba (26.8%, a difference of 0.050%), Immigrants from Belarus (26.8%, a difference of 0.060%), and Scotch-Irish (26.8%, a difference of 0.10%).
| Demographics | Rating | Rank | Family Households with Children |
| Navajo | 3.2 /100 | #241 | Tragic 26.9% |
| Immigrants | England | 3.2 /100 | #242 | Tragic 26.9% |
| Immigrants | Saudi Arabia | 2.9 /100 | #243 | Tragic 26.9% |
| Ukrainians | 2.9 /100 | #244 | Tragic 26.9% |
| Australians | 2.8 /100 | #245 | Tragic 26.9% |
| Jamaicans | 2.5 /100 | #246 | Tragic 26.9% |
| Potawatomi | 2.2 /100 | #247 | Tragic 26.9% |
| Immigrants | Kazakhstan | 2.2 /100 | #248 | Tragic 26.9% |
| Immigrants | Eastern Europe | 2.1 /100 | #249 | Tragic 26.9% |
| Belgians | 2.1 /100 | #250 | Tragic 26.9% |
| Immigrants | Bosnia and Herzegovina | 1.9 /100 | #251 | Tragic 26.8% |
| Irish | 1.8 /100 | #252 | Tragic 26.8% |
| Italians | 1.5 /100 | #253 | Tragic 26.8% |
| Immigrants | Scotland | 1.5 /100 | #254 | Tragic 26.8% |
| German Russians | 1.5 /100 | #255 | Tragic 26.8% |
| Scotch-Irish | 1.4 /100 | #256 | Tragic 26.8% |
| Slavs | 1.3 /100 | #257 | Tragic 26.8% |
| Immigrants | Cuba | 1.3 /100 | #258 | Tragic 26.8% |
| Immigrants | Lithuania | 1.2 /100 | #259 | Tragic 26.8% |
| Immigrants | Jamaica | 1.2 /100 | #260 | Tragic 26.8% |
| Immigrants | Belarus | 1.1 /100 | #261 | Tragic 26.8% |