Immigrants from England vs French Canadian Single Mother Households
COMPARE
Immigrants from England
French Canadian
Single Mother Households
Single Mother Households Comparison
Immigrants from England
French Canadians
5.8%
SINGLE MOTHER HOUSEHOLDS
95.5/ 100
METRIC RATING
111th/ 347
METRIC RANK
6.0%
SINGLE MOTHER HOUSEHOLDS
82.6/ 100
METRIC RATING
146th/ 347
METRIC RANK
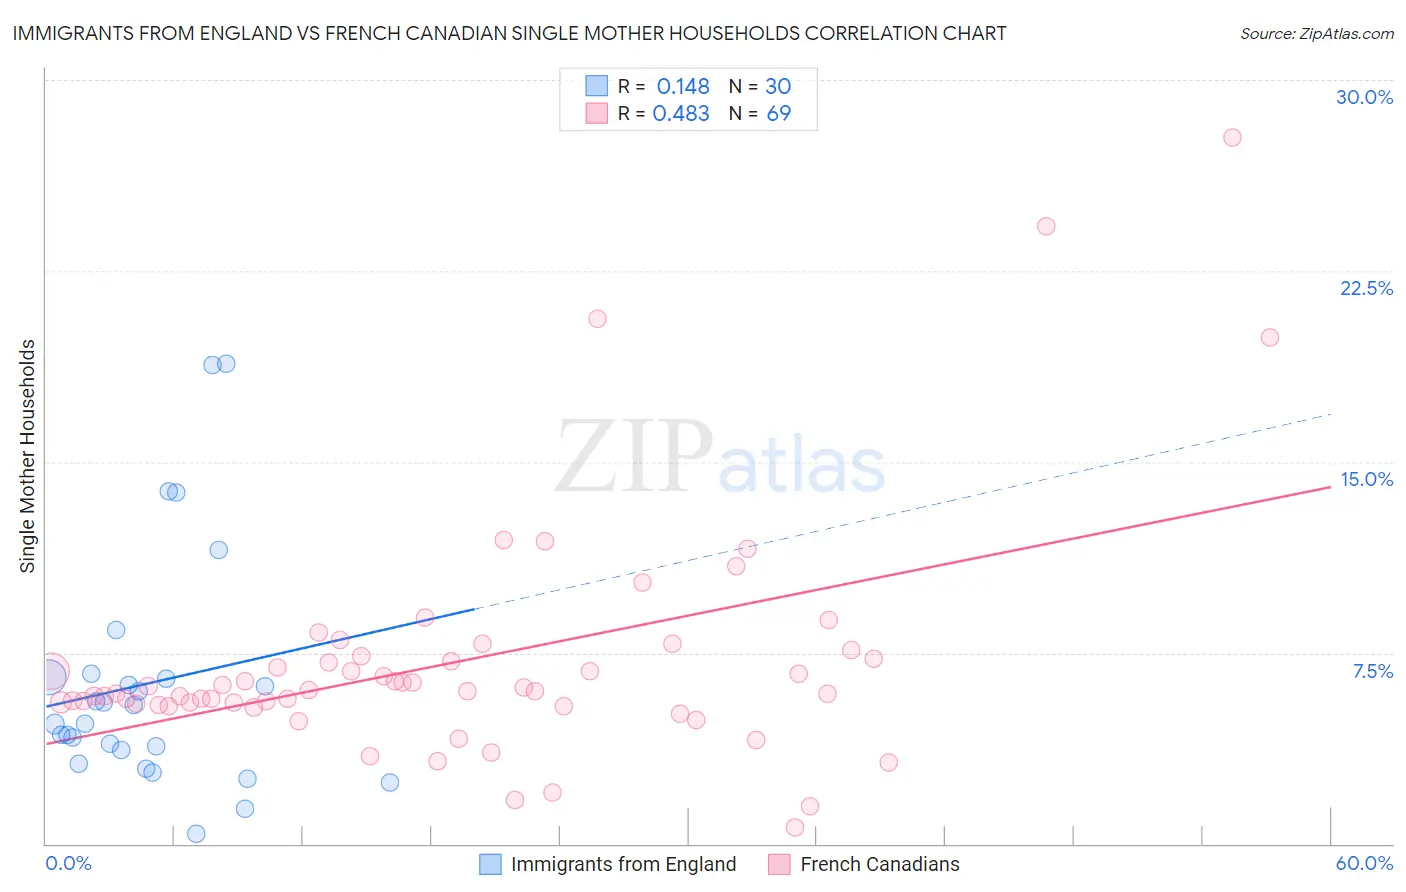
Immigrants from England vs French Canadian Single Mother Households Correlation Chart
The statistical analysis conducted on geographies consisting of 390,481,595 people shows a poor positive correlation between the proportion of Immigrants from England and percentage of single mother households in the United States with a correlation coefficient (R) of 0.148 and weighted average of 5.8%. Similarly, the statistical analysis conducted on geographies consisting of 499,765,796 people shows a moderate positive correlation between the proportion of French Canadians and percentage of single mother households in the United States with a correlation coefficient (R) of 0.483 and weighted average of 6.0%, a difference of 4.5%.
Single Mother Households Correlation Summary
| Measurement | Immigrants from England | French Canadian |
| Minimum | 0.40% | 0.62% |
| Maximum | 18.8% | 27.8% |
| Range | 18.4% | 27.1% |
| Mean | 6.3% | 7.1% |
| Median | 5.1% | 6.0% |
| Interquartile 25% (IQ1) | 3.7% | 5.5% |
| Interquartile 75% (IQ3) | 6.6% | 7.3% |
| Interquartile Range (IQR) | 2.9% | 1.8% |
| Standard Deviation (Sample) | 4.6% | 4.6% |
| Standard Deviation (Population) | 4.5% | 4.6% |
Similar Demographics by Single Mother Households
Demographics Similar to Immigrants from England by Single Mother Households
In terms of single mother households, the demographic groups most similar to Immigrants from England are British (5.8%, a difference of 0.030%), Immigrants from Kuwait (5.8%, a difference of 0.040%), Mongolian (5.8%, a difference of 0.11%), Immigrants from Western Europe (5.8%, a difference of 0.12%), and Immigrants from Italy (5.8%, a difference of 0.21%).
| Demographics | Rating | Rank | Single Mother Households |
| Northern Europeans | 96.2 /100 | #104 | Exceptional 5.8% |
| Taiwanese | 96.1 /100 | #105 | Exceptional 5.8% |
| Immigrants | Ukraine | 95.9 /100 | #106 | Exceptional 5.8% |
| Paraguayans | 95.8 /100 | #107 | Exceptional 5.8% |
| Immigrants | Italy | 95.8 /100 | #108 | Exceptional 5.8% |
| Immigrants | Western Europe | 95.7 /100 | #109 | Exceptional 5.8% |
| British | 95.5 /100 | #110 | Exceptional 5.8% |
| Immigrants | England | 95.5 /100 | #111 | Exceptional 5.8% |
| Immigrants | Kuwait | 95.4 /100 | #112 | Exceptional 5.8% |
| Mongolians | 95.3 /100 | #113 | Exceptional 5.8% |
| Dutch | 95.1 /100 | #114 | Exceptional 5.8% |
| Irish | 94.8 /100 | #115 | Exceptional 5.8% |
| Pennsylvania Germans | 94.7 /100 | #116 | Exceptional 5.8% |
| Bolivians | 94.6 /100 | #117 | Exceptional 5.8% |
| Laotians | 94.3 /100 | #118 | Exceptional 5.8% |
Demographics Similar to French Canadians by Single Mother Households
In terms of single mother households, the demographic groups most similar to French Canadians are Immigrants from Jordan (6.0%, a difference of 0.060%), Scotch-Irish (6.0%, a difference of 0.11%), Immigrants from Albania (6.1%, a difference of 0.21%), Arab (6.0%, a difference of 0.29%), and Zimbabwean (6.1%, a difference of 0.35%).
| Demographics | Rating | Rank | Single Mother Households |
| Syrians | 86.0 /100 | #139 | Excellent 6.0% |
| French | 85.7 /100 | #140 | Excellent 6.0% |
| Tsimshian | 85.2 /100 | #141 | Excellent 6.0% |
| Immigrants | Egypt | 85.0 /100 | #142 | Excellent 6.0% |
| Immigrants | Iraq | 84.8 /100 | #143 | Excellent 6.0% |
| Koreans | 84.4 /100 | #144 | Excellent 6.0% |
| Arabs | 84.0 /100 | #145 | Excellent 6.0% |
| French Canadians | 82.6 /100 | #146 | Excellent 6.0% |
| Immigrants | Jordan | 82.3 /100 | #147 | Excellent 6.0% |
| Scotch-Irish | 82.0 /100 | #148 | Excellent 6.0% |
| Immigrants | Albania | 81.5 /100 | #149 | Excellent 6.1% |
| Zimbabweans | 80.7 /100 | #150 | Excellent 6.1% |
| Immigrants | Southern Europe | 80.5 /100 | #151 | Excellent 6.1% |
| Pakistanis | 79.2 /100 | #152 | Good 6.1% |
| Immigrants | Brazil | 78.9 /100 | #153 | Good 6.1% |