Immigrants from Eastern Europe vs Hopi Married-couple Households
COMPARE
Immigrants from Eastern Europe
Hopi
Married-couple Households
Married-couple Households Comparison
Immigrants from Eastern Europe
Hopi
47.4%
MARRIED-COUPLE HOUSEHOLDS
90.3/ 100
METRIC RATING
121st/ 347
METRIC RANK
36.7%
MARRIED-COUPLE HOUSEHOLDS
0.0/ 100
METRIC RATING
345th/ 347
METRIC RANK
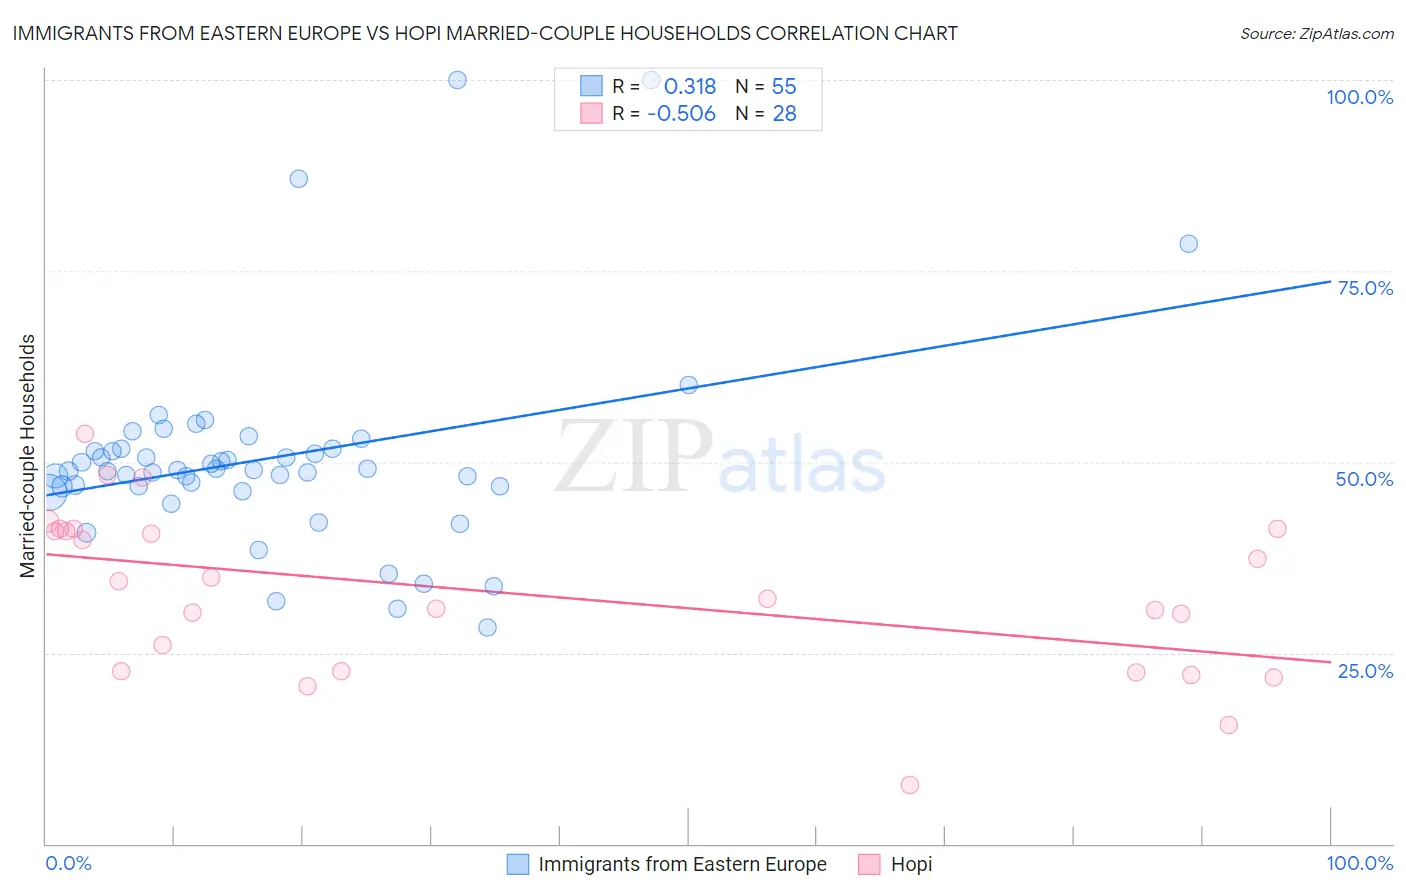
Immigrants from Eastern Europe vs Hopi Married-couple Households Correlation Chart
The statistical analysis conducted on geographies consisting of 475,489,582 people shows a mild positive correlation between the proportion of Immigrants from Eastern Europe and percentage of married-couple family households in the United States with a correlation coefficient (R) of 0.318 and weighted average of 47.4%. Similarly, the statistical analysis conducted on geographies consisting of 74,731,609 people shows a substantial negative correlation between the proportion of Hopi and percentage of married-couple family households in the United States with a correlation coefficient (R) of -0.506 and weighted average of 36.7%, a difference of 29.3%.
Married-couple Households Correlation Summary
| Measurement | Immigrants from Eastern Europe | Hopi |
| Minimum | 28.4% | 7.8% |
| Maximum | 100.0% | 53.7% |
| Range | 71.6% | 45.9% |
| Mean | 50.5% | 32.9% |
| Median | 49.0% | 33.2% |
| Interquartile 25% (IQ1) | 46.8% | 22.6% |
| Interquartile 75% (IQ3) | 51.7% | 41.0% |
| Interquartile Range (IQR) | 4.9% | 18.4% |
| Standard Deviation (Sample) | 13.5% | 10.8% |
| Standard Deviation (Population) | 13.4% | 10.6% |
Similar Demographics by Married-couple Households
Demographics Similar to Immigrants from Eastern Europe by Married-couple Households
In terms of married-couple households, the demographic groups most similar to Immigrants from Eastern Europe are Puget Sound Salish (47.4%, a difference of 0.020%), Okinawan (47.4%, a difference of 0.020%), Immigrants from Venezuela (47.4%, a difference of 0.10%), Zimbabwean (47.4%, a difference of 0.11%), and Australian (47.4%, a difference of 0.13%).
| Demographics | Rating | Rank | Married-couple Households |
| Immigrants | Europe | 93.7 /100 | #114 | Exceptional 47.6% |
| Slovaks | 92.9 /100 | #115 | Exceptional 47.6% |
| Argentineans | 92.5 /100 | #116 | Exceptional 47.5% |
| French Canadians | 92.4 /100 | #117 | Exceptional 47.5% |
| Immigrants | Germany | 92.4 /100 | #118 | Exceptional 47.5% |
| Chileans | 92.2 /100 | #119 | Exceptional 47.5% |
| Puget Sound Salish | 90.5 /100 | #120 | Exceptional 47.4% |
| Immigrants | Eastern Europe | 90.3 /100 | #121 | Exceptional 47.4% |
| Okinawans | 90.1 /100 | #122 | Exceptional 47.4% |
| Immigrants | Venezuela | 89.3 /100 | #123 | Excellent 47.4% |
| Zimbabweans | 89.2 /100 | #124 | Excellent 47.4% |
| Australians | 89.0 /100 | #125 | Excellent 47.4% |
| Pakistanis | 88.6 /100 | #126 | Excellent 47.3% |
| Celtics | 88.1 /100 | #127 | Excellent 47.3% |
| Immigrants | Peru | 87.9 /100 | #128 | Excellent 47.3% |
Demographics Similar to Hopi by Married-couple Households
In terms of married-couple households, the demographic groups most similar to Hopi are Immigrants from Cabo Verde (36.2%, a difference of 1.2%), Immigrants from Dominican Republic (37.3%, a difference of 1.8%), Immigrants from Grenada (37.5%, a difference of 2.2%), Pima (35.6%, a difference of 3.2%), and Tohono O'odham (37.9%, a difference of 3.3%).
| Demographics | Rating | Rank | Married-couple Households |
| Immigrants | West Indies | 0.0 /100 | #333 | Tragic 39.0% |
| Immigrants | St. Vincent and the Grenadines | 0.0 /100 | #334 | Tragic 38.7% |
| Senegalese | 0.0 /100 | #335 | Tragic 38.6% |
| Blacks/African Americans | 0.0 /100 | #336 | Tragic 38.5% |
| Immigrants | Somalia | 0.0 /100 | #337 | Tragic 38.4% |
| Immigrants | Senegal | 0.0 /100 | #338 | Tragic 38.4% |
| British West Indians | 0.0 /100 | #339 | Tragic 38.3% |
| Dominicans | 0.0 /100 | #340 | Tragic 38.2% |
| Cape Verdeans | 0.0 /100 | #341 | Tragic 38.1% |
| Tohono O'odham | 0.0 /100 | #342 | Tragic 37.9% |
| Immigrants | Grenada | 0.0 /100 | #343 | Tragic 37.5% |
| Immigrants | Dominican Republic | 0.0 /100 | #344 | Tragic 37.3% |
| Hopi | 0.0 /100 | #345 | Tragic 36.7% |
| Immigrants | Cabo Verde | 0.0 /100 | #346 | Tragic 36.2% |
| Pima | 0.0 /100 | #347 | Tragic 35.6% |