Immigrants from Eastern Asia vs Immigrants from Vietnam Currently Married

COMPARE

Immigrants from Eastern Asia
Race
Ancestry
AfghanAfricanAlaska NativeAlaskan AthabascanAlbanianAleutAlsatianAmericanApacheArabArapahoArgentineanArmenianAssyrian/Chaldean/SyriacAustralianAustrianBahamianBangladeshiBarbadianBasqueBelgianBelizeanBermudanBhutaneseBlackfeetBolivianBrazilianBritishBritish West IndianBulgarianBurmeseCajunCambodianCanadianCape VerdeanCarpatho RusynCelticCentral AmericanCentral American IndianCherokeeCheyenneChickasawChileanChineseChippewaChoctawColombianColvilleComancheCosta RicanCreeCreekCroatianCrowCubanCypriotCzechCzechoslovakianDanishDelawareDominicanDutchDutch West IndianEastern EuropeanEcuadorianEgyptianEnglishEstonianEthiopianEuropeanFijianFilipinoFinnishFrenchFrench American IndianFrench CanadianGermanGerman RussianGhanaianGreekGuamanian/ChamorroGuatemalanGuyaneseHaitianHmongHonduranHopiHoumaHungarianIcelanderIndian (Asian)IndonesianInupiatIranianIraqiIrishIroquoisIsraeliItalianJamaicanJapaneseJordanianKenyanKiowaKoreanLaotianLatvianLebaneseLiberianLithuanianLumbeeLuxembourgerMacedonianMalaysianMalteseMarshalleseMenomineeMexicanMexican American IndianMongolianMoroccanNative HawaiianNavajoNepaleseNew ZealanderNicaraguanNigerianNorthern EuropeanNorwegianOkinawanOsageOttawaPaiutePakistaniPalestinianPanamanianParaguayanPennsylvania GermanPeruvianPimaPolishPortuguesePotawatomiPuebloPuerto RicanPuget Sound SalishRomanianRussianSalvadoranSamoanScandinavianScotch-IrishScottishSeminoleSenegaleseSerbianShoshoneSierra LeoneanSiouxSlavicSlovakSloveneSomaliSouth AfricanSouth AmericanSouth American IndianSoviet UnionSpaniardSpanishSpanish AmericanSpanish American IndianSri LankanSubsaharan AfricanSudaneseSwedishSwissSyrianTaiwaneseThaiTlingit-HaidaTohono O'OdhamTonganTrinidadian and TobagonianTsimshianTurkishU.S. Virgin IslanderUgandanUkrainianUruguayanUteVenezuelanVietnameseWelshWest IndianYakamaYaquiYugoslavianYumanYup'ikZimbabwean
Immigration
NonimmigrantsImmigrantsAfghanistanAfricaAlbaniaArgentinaArmeniaAsiaAustraliaAustriaBahamasBangladeshBarbadosBelarusBelgiumBelizeBoliviaBosnia and HerzegovinaBrazilBulgariaBurma/MyanmarCabo VerdeCambodiaCameroonCanadaCaribbeanCentral AmericaChileChinaColombiaCongoCosta RicaCroatiaCubaCzechoslovakiaDenmarkDominicaDominican RepublicEastern AfricaEastern AsiaEastern EuropeEcuadorEgyptEl SalvadorEnglandEritreaEthiopiaEuropeFijiFranceGermanyGhanaGreeceGrenadaGuatemalaGuyanaHaitiHondurasHong KongHungaryIndiaIndonesiaIranIraqIrelandIsraelItalyJamaicaJapanJordanKazakhstanKenyaKoreaKuwaitLaosLatin AmericaLatviaLebanonLiberiaLithuaniaMalaysiaMexicoMicronesiaMiddle AfricaMoldovaMoroccoNepalNetherlandsNicaraguaNigeriaNorth AmericaNorth MacedoniaNorthern AfricaNorthern EuropeNorwayOceaniaPakistanPanamaPeruPhilippinesPolandPortugalRomaniaRussiaSaudi ArabiaScotlandSenegalSerbiaSierra LeoneSingaporeSomaliaSouth AfricaSouth AmericaSouth Central AsiaSouth Eastern AsiaSouthern EuropeSpainSri LankaSt. Vincent and the GrenadinesSudanSwedenSwitzerlandSyriaTaiwanThailandTrinidad and TobagoTurkeyUgandaUkraineUruguayUzbekistanVenezuelaWest IndiesWestern AfricaWestern AsiaWestern EuropeYemenZaireZimbabweAzores
Immigrants from Vietnam
Race
Ancestry
AfghanAfricanAlaska NativeAlaskan AthabascanAlbanianAleutAlsatianAmericanApacheArabArapahoArgentineanArmenianAssyrian/Chaldean/SyriacAustralianAustrianBahamianBangladeshiBarbadianBasqueBelgianBelizeanBermudanBhutaneseBlackfeetBolivianBrazilianBritishBritish West IndianBulgarianBurmeseCajunCambodianCanadianCape VerdeanCarpatho RusynCelticCentral AmericanCentral American IndianCherokeeCheyenneChickasawChileanChineseChippewaChoctawColombianColvilleComancheCosta RicanCreeCreekCroatianCrowCubanCypriotCzechCzechoslovakianDanishDelawareDominicanDutchDutch West IndianEastern EuropeanEcuadorianEgyptianEnglishEstonianEthiopianEuropeanFijianFilipinoFinnishFrenchFrench American IndianFrench CanadianGermanGerman RussianGhanaianGreekGuamanian/ChamorroGuatemalanGuyaneseHaitianHmongHonduranHopiHoumaHungarianIcelanderIndian (Asian)IndonesianInupiatIranianIraqiIrishIroquoisIsraeliItalianJamaicanJapaneseJordanianKenyanKiowaKoreanLaotianLatvianLebaneseLiberianLithuanianLumbeeLuxembourgerMacedonianMalaysianMalteseMarshalleseMenomineeMexicanMexican American IndianMongolianMoroccanNative HawaiianNavajoNepaleseNew ZealanderNicaraguanNigerianNorthern EuropeanNorwegianOkinawanOsageOttawaPaiutePakistaniPalestinianPanamanianParaguayanPennsylvania GermanPeruvianPimaPolishPortuguesePotawatomiPuebloPuerto RicanPuget Sound SalishRomanianRussianSalvadoranSamoanScandinavianScotch-IrishScottishSeminoleSenegaleseSerbianShoshoneSierra LeoneanSiouxSlavicSlovakSloveneSomaliSouth AfricanSouth AmericanSouth American IndianSoviet UnionSpaniardSpanishSpanish AmericanSpanish American IndianSri LankanSubsaharan AfricanSudaneseSwedishSwissSyrianTaiwaneseThaiTlingit-HaidaTohono O'OdhamTonganTrinidadian and TobagonianTsimshianTurkishU.S. Virgin IslanderUgandanUkrainianUruguayanUteVenezuelanVietnameseWelshWest IndianYakamaYaquiYugoslavianYumanYup'ikZimbabwean
Immigration
NonimmigrantsImmigrantsAfghanistanAfricaAlbaniaArgentinaArmeniaAsiaAustraliaAustriaBahamasBangladeshBarbadosBelarusBelgiumBelizeBoliviaBosnia and HerzegovinaBrazilBulgariaBurma/MyanmarCabo VerdeCambodiaCameroonCanadaCaribbeanCentral AmericaChileChinaColombiaCongoCosta RicaCroatiaCubaCzechoslovakiaDenmarkDominicaDominican RepublicEastern AfricaEastern EuropeEcuadorEgyptEl SalvadorEnglandEritreaEthiopiaEuropeFijiFranceGermanyGhanaGreeceGrenadaGuatemalaGuyanaHaitiHondurasHong KongHungaryIndiaIndonesiaIranIraqIrelandIsraelItalyJamaicaJapanJordanKazakhstanKenyaKoreaKuwaitLaosLatin AmericaLatviaLebanonLiberiaLithuaniaMalaysiaMexicoMicronesiaMiddle AfricaMoldovaMoroccoNepalNetherlandsNicaraguaNigeriaNorth AmericaNorth MacedoniaNorthern AfricaNorthern EuropeNorwayOceaniaPakistanPanamaPeruPhilippinesPolandPortugalRomaniaRussiaSaudi ArabiaScotlandSenegalSerbiaSierra LeoneSingaporeSomaliaSouth AfricaSouth AmericaSouth Central AsiaSouth Eastern AsiaSouthern EuropeSpainSri LankaSt. Vincent and the GrenadinesSudanSwedenSwitzerlandSyriaTaiwanThailandTrinidad and TobagoTurkeyUgandaUkraineUruguayUzbekistanVenezuelaVietnamWest IndiesWestern AfricaWestern AsiaWestern EuropeYemenZaireZimbabweAzores
Currently Married
Income
Poverty
Unemployment
Labor Participation
Family Structure
Vehicle Availability
Education Level
Disability

Currently Married Comparison

Immigrants from Eastern Asia

Immigrants from Vietnam

Exceptional
Good
48.2%
CURRENTLY MARRIED
97.5/ 100
METRIC RATING
73rd/ 347
METRIC RANK
47.2%
CURRENTLY MARRIED
78.2/ 100
METRIC RATING
136th/ 347
METRIC RANK

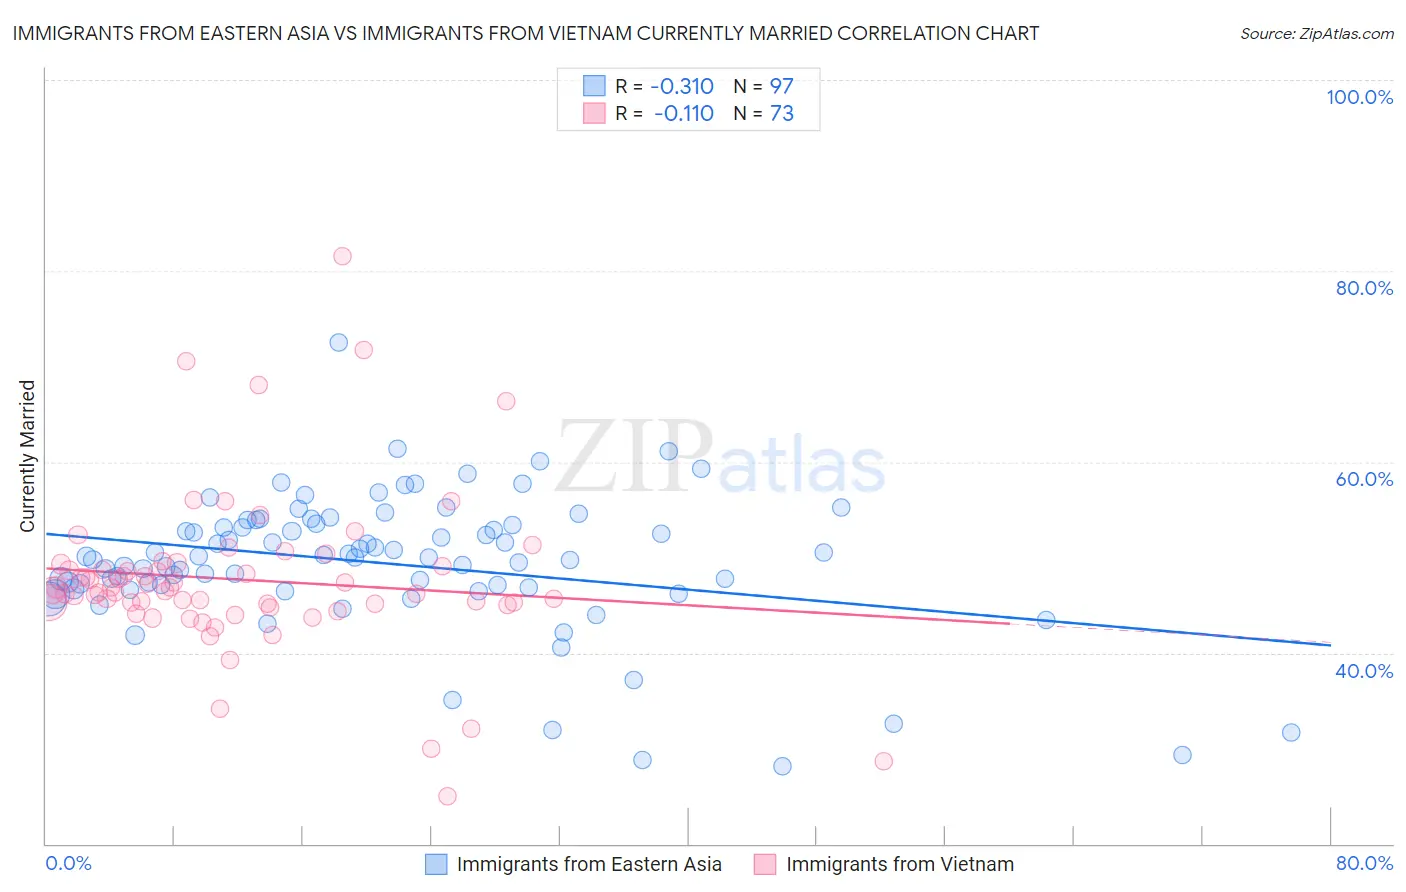
Immigrants from Eastern Asia vs Immigrants from Vietnam Currently Married Correlation Chart

The statistical analysis conducted on geographies consisting of 499,820,876 people shows a mild negative correlation between the proportion of Immigrants from Eastern Asia and percentage of population currently married in the United States with a correlation coefficient (R) of -0.310 and weighted average of 48.2%. Similarly, the statistical analysis conducted on geographies consisting of 404,782,059 people shows a poor negative correlation between the proportion of Immigrants from Vietnam and percentage of population currently married in the United States with a correlation coefficient (R) of -0.110 and weighted average of 47.2%, a difference of 2.2%.
Immigrants from Eastern Asia vs Immigrants from Vietnam Currently Married

Currently Married Correlation Summary

MeasurementImmigrants from Eastern AsiaImmigrants from Vietnam
Minimum28.1%25.0%
Maximum72.5%81.5%
Range44.4%56.5%
Mean49.4%47.7%
Median50.0%46.5%
Interquartile 25% (IQ1)46.8%45.0%
Interquartile 75% (IQ3)53.5%49.2%
Interquartile Range (IQR)6.7%4.1%
Standard Deviation (Sample)7.2%8.6%
Standard Deviation (Population)7.2%8.5%

Similar Demographics by Currently Married

Demographics Similar to Immigrants from Eastern Asia by Currently Married

In terms of currently married, the demographic groups most similar to Immigrants from Eastern Asia are Immigrants from Lebanon (48.2%, a difference of 0.020%), Estonian (48.2%, a difference of 0.030%), Immigrants from Belarus (48.1%, a difference of 0.10%), Basque (48.1%, a difference of 0.12%), and Slovene (48.1%, a difference of 0.14%).
DemographicsRating | RankCurrently Married
Tongans
98.2
/100
|
#66
Exceptional
48.3%
Slovaks
98.2
/100
|
#67
Exceptional
48.3%
Immigrants | England
98.2
/100
|
#68
Exceptional
48.3%
Canadians
98.1
/100
|
#69
Exceptional
48.3%
Immigrants | Asia
97.9
/100
|
#70
Exceptional
48.3%
Macedonians
97.9
/100
|
#71
Exceptional
48.3%
Immigrants | Lebanon
97.6
/100
|
#72
Exceptional
48.2%
Immigrants | Eastern Asia
97.5
/100
|
#73
Exceptional
48.2%
Estonians
97.4
/100
|
#74
Exceptional
48.2%
Immigrants | Belarus
97.2
/100
|
#75
Exceptional
48.1%
Basques
97.2
/100
|
#76
Exceptional
48.1%
Slovenes
97.1
/100
|
#77
Exceptional
48.1%
Immigrants | Belgium
97.1
/100
|
#78
Exceptional
48.1%
Immigrants | South Africa
97.0
/100
|
#79
Exceptional
48.1%
Immigrants | Poland
96.9
/100
|
#80
Exceptional
48.1%

Demographics Similar to Immigrants from Vietnam by Currently Married

In terms of currently married, the demographic groups most similar to Immigrants from Vietnam are Paraguayan (47.2%, a difference of 0.020%), Pakistani (47.2%, a difference of 0.040%), Yugoslavian (47.2%, a difference of 0.040%), Immigrants from Norway (47.2%, a difference of 0.080%), and Cajun (47.1%, a difference of 0.15%).
DemographicsRating | RankCurrently Married
Sri Lankans
83.2
/100
|
#129
Excellent
47.3%
Immigrants | Iraq
82.8
/100
|
#130
Excellent
47.3%
Icelanders
82.4
/100
|
#131
Excellent
47.3%
Afghans
81.8
/100
|
#132
Excellent
47.3%
Immigrants | Malaysia
81.1
/100
|
#133
Excellent
47.3%
Immigrants | Australia
81.1
/100
|
#134
Excellent
47.3%
Immigrants | Norway
79.7
/100
|
#135
Good
47.2%
Immigrants | Vietnam
78.2
/100
|
#136
Good
47.2%
Paraguayans
77.8
/100
|
#137
Good
47.2%
Pakistanis
77.5
/100
|
#138
Good
47.2%
Yugoslavians
77.4
/100
|
#139
Good
47.2%
Cajuns
75.3
/100
|
#140
Good
47.1%
Venezuelans
74.4
/100
|
#141
Good
47.1%
Argentineans
74.4
/100
|
#142
Good
47.1%
Guamanians/Chamorros
74.2
/100
|
#143
Good
47.1%