Immigrants from Dominican Republic vs Belizean Single Father Households
COMPARE
Immigrants from Dominican Republic
Belizean
Single Father Households
Single Father Households Comparison
Immigrants from Dominican Republic
Belizeans
2.6%
SINGLE FATHER HOUSEHOLDS
0.2/ 100
METRIC RATING
275th/ 347
METRIC RANK
2.6%
SINGLE FATHER HOUSEHOLDS
0.2/ 100
METRIC RATING
272nd/ 347
METRIC RANK
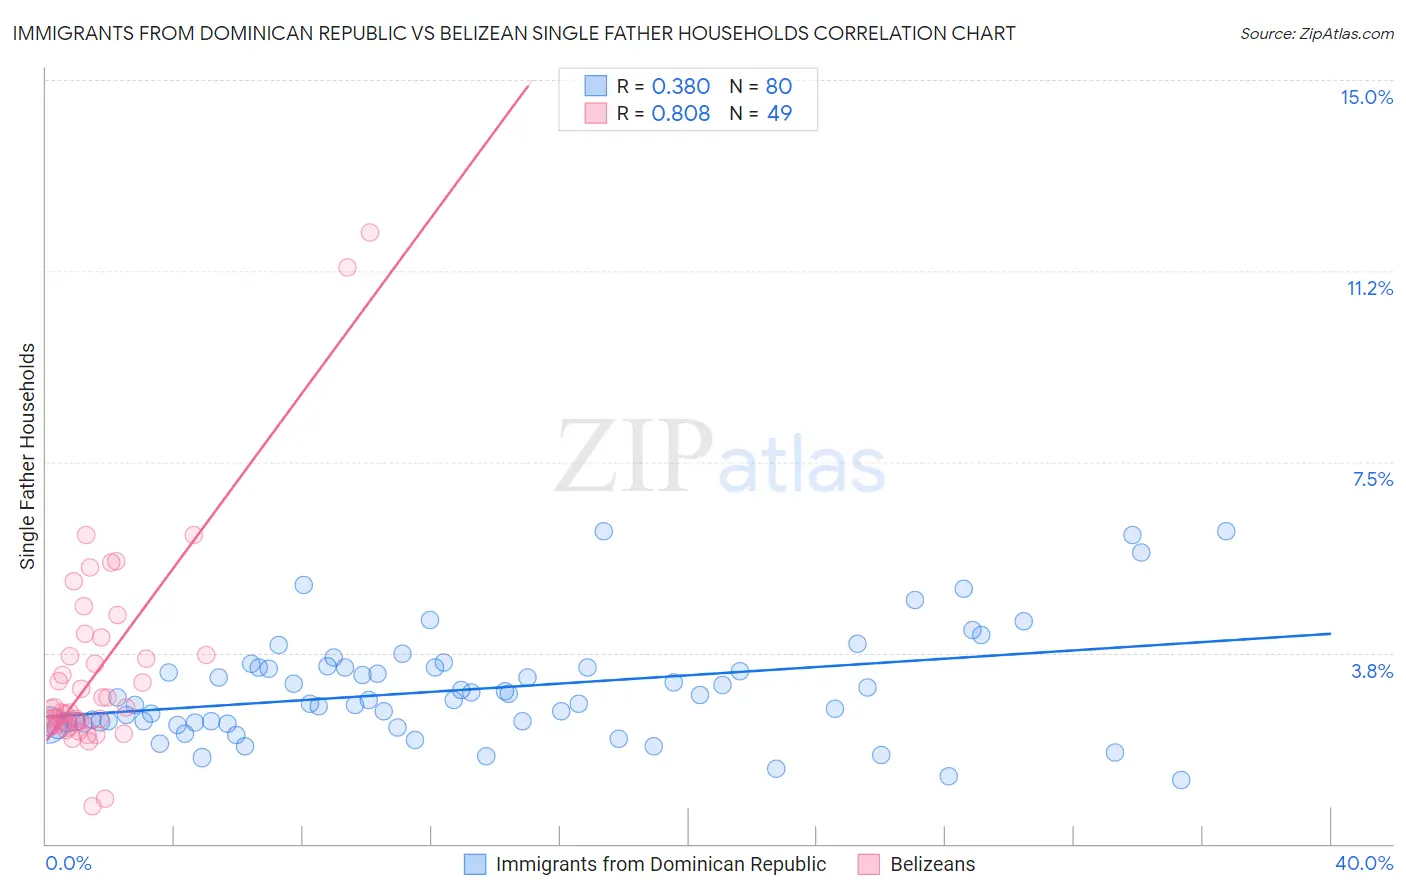
Immigrants from Dominican Republic vs Belizean Single Father Households Correlation Chart
The statistical analysis conducted on geographies consisting of 273,173,003 people shows a mild positive correlation between the proportion of Immigrants from Dominican Republic and percentage of single father households in the United States with a correlation coefficient (R) of 0.380 and weighted average of 2.6%. Similarly, the statistical analysis conducted on geographies consisting of 143,901,350 people shows a very strong positive correlation between the proportion of Belizeans and percentage of single father households in the United States with a correlation coefficient (R) of 0.808 and weighted average of 2.6%, a difference of 0.49%.
Single Father Households Correlation Summary
| Measurement | Immigrants from Dominican Republic | Belizean |
| Minimum | 1.3% | 0.75% |
| Maximum | 6.1% | 12.0% |
| Range | 4.9% | 11.3% |
| Mean | 3.0% | 3.4% |
| Median | 2.8% | 2.6% |
| Interquartile 25% (IQ1) | 2.4% | 2.3% |
| Interquartile 75% (IQ3) | 3.5% | 3.9% |
| Interquartile Range (IQR) | 1.1% | 1.6% |
| Standard Deviation (Sample) | 1.1% | 2.1% |
| Standard Deviation (Population) | 1.1% | 2.1% |
Demographics Similar to Immigrants from Dominican Republic and Belizeans by Single Father Households
In terms of single father households, the demographic groups most similar to Immigrants from Dominican Republic are Immigrants from Haiti (2.6%, a difference of 0.21%), Shoshone (2.6%, a difference of 0.24%), Cherokee (2.6%, a difference of 0.29%), Samoan (2.6%, a difference of 0.33%), and Puerto Rican (2.6%, a difference of 0.42%). Similarly, the demographic groups most similar to Belizeans are Creek (2.6%, a difference of 0.0%), Iroquois (2.6%, a difference of 0.040%), Puerto Rican (2.6%, a difference of 0.070%), Seminole (2.6%, a difference of 0.37%), and Cuban (2.6%, a difference of 0.50%).
| Demographics | Rating | Rank | Single Father Households |
| Dominicans | 0.8 /100 | #263 | Tragic 2.5% |
| Indonesians | 0.5 /100 | #264 | Tragic 2.6% |
| Immigrants | Micronesia | 0.5 /100 | #265 | Tragic 2.6% |
| French American Indians | 0.5 /100 | #266 | Tragic 2.6% |
| Guamanians/Chamorros | 0.4 /100 | #267 | Tragic 2.6% |
| Haitians | 0.4 /100 | #268 | Tragic 2.6% |
| Cubans | 0.3 /100 | #269 | Tragic 2.6% |
| Seminole | 0.3 /100 | #270 | Tragic 2.6% |
| Creek | 0.2 /100 | #271 | Tragic 2.6% |
| Belizeans | 0.2 /100 | #272 | Tragic 2.6% |
| Iroquois | 0.2 /100 | #273 | Tragic 2.6% |
| Puerto Ricans | 0.2 /100 | #274 | Tragic 2.6% |
| Immigrants | Dominican Republic | 0.2 /100 | #275 | Tragic 2.6% |
| Immigrants | Haiti | 0.1 /100 | #276 | Tragic 2.6% |
| Shoshone | 0.1 /100 | #277 | Tragic 2.6% |
| Cherokee | 0.1 /100 | #278 | Tragic 2.6% |
| Samoans | 0.1 /100 | #279 | Tragic 2.6% |
| Immigrants | Portugal | 0.1 /100 | #280 | Tragic 2.6% |
| Nicaraguans | 0.1 /100 | #281 | Tragic 2.6% |
| Dutch West Indians | 0.1 /100 | #282 | Tragic 2.6% |
| Immigrants | Nicaragua | 0.1 /100 | #283 | Tragic 2.7% |