Immigrants from China vs Palestinian Births to Unmarried Women
COMPARE
Immigrants from China
Palestinian
Births to Unmarried Women
Births to Unmarried Women Comparison
Immigrants from China
Palestinians
24.7%
BIRTHS TO UNMARRIED WOMEN
100.0/ 100
METRIC RATING
8th/ 347
METRIC RANK
28.4%
BIRTHS TO UNMARRIED WOMEN
98.7/ 100
METRIC RATING
67th/ 347
METRIC RANK
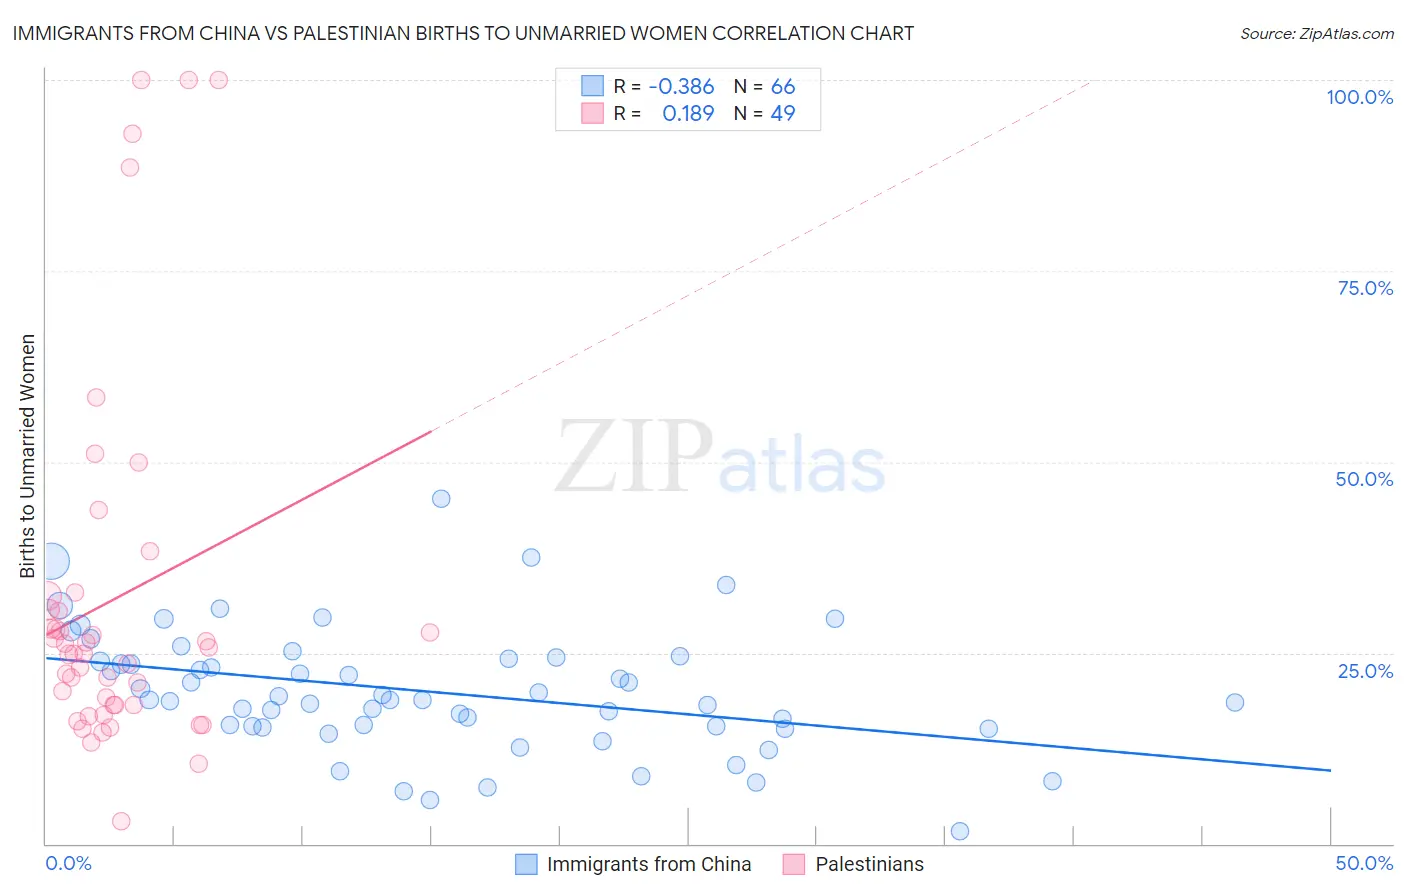
Immigrants from China vs Palestinian Births to Unmarried Women Correlation Chart
The statistical analysis conducted on geographies consisting of 420,563,672 people shows a mild negative correlation between the proportion of Immigrants from China and percentage of births to unmarried women in the United States with a correlation coefficient (R) of -0.386 and weighted average of 24.7%. Similarly, the statistical analysis conducted on geographies consisting of 207,464,489 people shows a poor positive correlation between the proportion of Palestinians and percentage of births to unmarried women in the United States with a correlation coefficient (R) of 0.189 and weighted average of 28.4%, a difference of 15.2%.
Births to Unmarried Women Correlation Summary
| Measurement | Immigrants from China | Palestinian |
| Minimum | 1.6% | 2.9% |
| Maximum | 45.2% | 100.0% |
| Range | 43.6% | 97.1% |
| Mean | 19.9% | 32.1% |
| Median | 18.9% | 24.9% |
| Interquartile 25% (IQ1) | 15.3% | 18.1% |
| Interquartile 75% (IQ3) | 24.2% | 31.6% |
| Interquartile Range (IQR) | 8.9% | 13.5% |
| Standard Deviation (Sample) | 8.1% | 24.2% |
| Standard Deviation (Population) | 8.0% | 23.9% |
Similar Demographics by Births to Unmarried Women
Demographics Similar to Immigrants from China by Births to Unmarried Women
In terms of births to unmarried women, the demographic groups most similar to Immigrants from China are Immigrants from South Central Asia (24.7%, a difference of 0.010%), Immigrants from Eastern Asia (25.0%, a difference of 1.5%), Immigrants from Israel (25.1%, a difference of 1.9%), Indian (Asian) (25.3%, a difference of 2.4%), and Iranian (25.3%, a difference of 2.5%).
| Demographics | Rating | Rank | Births to Unmarried Women |
| Assyrians/Chaldeans/Syriacs | 100.0 /100 | #1 | Exceptional 22.0% |
| Immigrants | India | 100.0 /100 | #2 | Exceptional 22.9% |
| Filipinos | 100.0 /100 | #3 | Exceptional 23.0% |
| Immigrants | Taiwan | 100.0 /100 | #4 | Exceptional 23.0% |
| Immigrants | Hong Kong | 100.0 /100 | #5 | Exceptional 23.6% |
| Immigrants | Iran | 100.0 /100 | #6 | Exceptional 24.0% |
| Thais | 100.0 /100 | #7 | Exceptional 24.0% |
| Immigrants | China | 100.0 /100 | #8 | Exceptional 24.7% |
| Immigrants | South Central Asia | 100.0 /100 | #9 | Exceptional 24.7% |
| Immigrants | Eastern Asia | 100.0 /100 | #10 | Exceptional 25.0% |
| Immigrants | Israel | 100.0 /100 | #11 | Exceptional 25.1% |
| Indians (Asian) | 100.0 /100 | #12 | Exceptional 25.3% |
| Iranians | 100.0 /100 | #13 | Exceptional 25.3% |
| Immigrants | Lebanon | 100.0 /100 | #14 | Exceptional 25.3% |
| Immigrants | Singapore | 100.0 /100 | #15 | Exceptional 25.6% |
Demographics Similar to Palestinians by Births to Unmarried Women
In terms of births to unmarried women, the demographic groups most similar to Palestinians are Immigrants from Europe (28.4%, a difference of 0.050%), Bolivian (28.5%, a difference of 0.090%), Immigrants from Egypt (28.4%, a difference of 0.11%), Immigrants from Czechoslovakia (28.4%, a difference of 0.13%), and Tongan (28.4%, a difference of 0.15%).
| Demographics | Rating | Rank | Births to Unmarried Women |
| Immigrants | Turkey | 99.1 /100 | #60 | Exceptional 28.1% |
| Immigrants | North Macedonia | 99.1 /100 | #61 | Exceptional 28.1% |
| Egyptians | 99.0 /100 | #62 | Exceptional 28.2% |
| Immigrants | Serbia | 98.9 /100 | #63 | Exceptional 28.3% |
| Tongans | 98.8 /100 | #64 | Exceptional 28.4% |
| Immigrants | Czechoslovakia | 98.8 /100 | #65 | Exceptional 28.4% |
| Immigrants | Egypt | 98.8 /100 | #66 | Exceptional 28.4% |
| Palestinians | 98.7 /100 | #67 | Exceptional 28.4% |
| Immigrants | Europe | 98.7 /100 | #68 | Exceptional 28.4% |
| Bolivians | 98.7 /100 | #69 | Exceptional 28.5% |
| Laotians | 98.6 /100 | #70 | Exceptional 28.5% |
| Jordanians | 98.5 /100 | #71 | Exceptional 28.5% |
| Immigrants | Sweden | 98.5 /100 | #72 | Exceptional 28.5% |
| Albanians | 98.5 /100 | #73 | Exceptional 28.5% |
| Immigrants | Bolivia | 98.5 /100 | #74 | Exceptional 28.6% |