Immigrants from Chile vs Yaqui Divorced or Separated
COMPARE
Immigrants from Chile
Yaqui
Divorced or Separated
Divorced or Separated Comparison
Immigrants from Chile
Yaqui
12.1%
DIVORCED OR SEPARATED
39.0/ 100
METRIC RATING
186th/ 347
METRIC RANK
13.3%
DIVORCED OR SEPARATED
0.0/ 100
METRIC RATING
314th/ 347
METRIC RANK
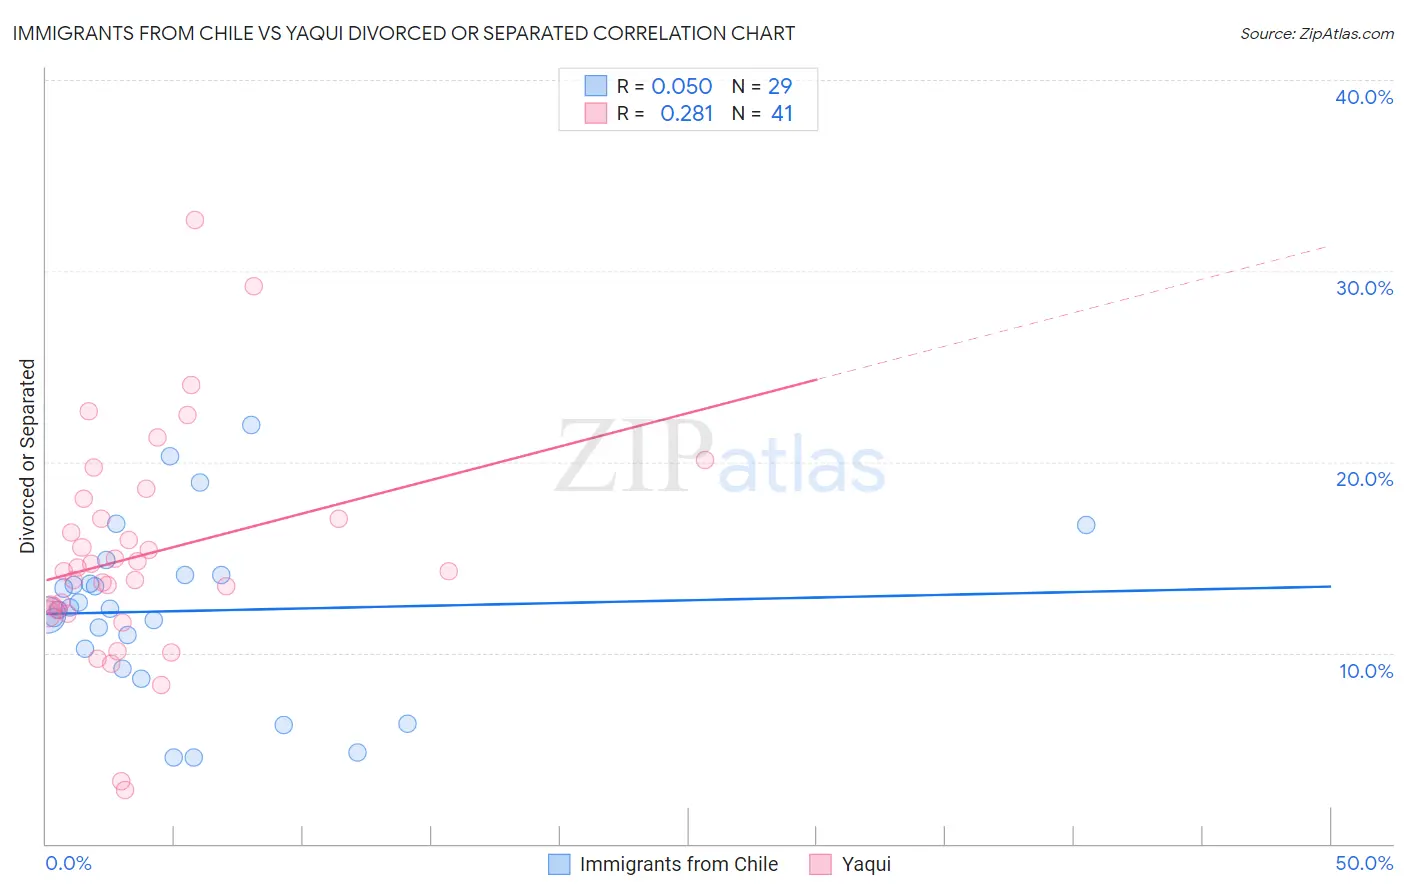
Immigrants from Chile vs Yaqui Divorced or Separated Correlation Chart
The statistical analysis conducted on geographies consisting of 218,625,132 people shows no correlation between the proportion of Immigrants from Chile and percentage of population currently divorced or separated in the United States with a correlation coefficient (R) of 0.050 and weighted average of 12.1%. Similarly, the statistical analysis conducted on geographies consisting of 107,734,723 people shows a weak positive correlation between the proportion of Yaqui and percentage of population currently divorced or separated in the United States with a correlation coefficient (R) of 0.281 and weighted average of 13.3%, a difference of 10.0%.
Divorced or Separated Correlation Summary
| Measurement | Immigrants from Chile | Yaqui |
| Minimum | 4.5% | 2.8% |
| Maximum | 21.9% | 32.7% |
| Range | 17.4% | 29.9% |
| Mean | 12.2% | 15.1% |
| Median | 12.3% | 14.3% |
| Interquartile 25% (IQ1) | 9.7% | 12.2% |
| Interquartile 75% (IQ3) | 14.1% | 17.5% |
| Interquartile Range (IQR) | 4.4% | 5.4% |
| Standard Deviation (Sample) | 4.4% | 5.8% |
| Standard Deviation (Population) | 4.3% | 5.7% |
Similar Demographics by Divorced or Separated
Demographics Similar to Immigrants from Chile by Divorced or Separated
In terms of divorced or separated, the demographic groups most similar to Immigrants from Chile are Immigrants from Nigeria (12.1%, a difference of 0.050%), Belizean (12.1%, a difference of 0.050%), Immigrants from Belize (12.1%, a difference of 0.050%), Immigrants from North America (12.1%, a difference of 0.070%), and Sierra Leonean (12.1%, a difference of 0.13%).
| Demographics | Rating | Rank | Divorced or Separated |
| Immigrants | Western Europe | 45.6 /100 | #179 | Average 12.1% |
| Barbadians | 45.0 /100 | #180 | Average 12.1% |
| Immigrants | Canada | 44.0 /100 | #181 | Average 12.1% |
| Immigrants | Ethiopia | 43.1 /100 | #182 | Average 12.1% |
| Immigrants | Central America | 42.9 /100 | #183 | Average 12.1% |
| Immigrants | North America | 41.1 /100 | #184 | Average 12.1% |
| Immigrants | Nigeria | 40.5 /100 | #185 | Average 12.1% |
| Immigrants | Chile | 39.0 /100 | #186 | Fair 12.1% |
| Belizeans | 37.7 /100 | #187 | Fair 12.1% |
| Immigrants | Belize | 37.6 /100 | #188 | Fair 12.1% |
| Sierra Leoneans | 35.5 /100 | #189 | Fair 12.1% |
| Moroccans | 34.8 /100 | #190 | Fair 12.1% |
| Swedes | 34.4 /100 | #191 | Fair 12.1% |
| Norwegians | 33.2 /100 | #192 | Fair 12.1% |
| Immigrants | Thailand | 32.5 /100 | #193 | Fair 12.1% |
Demographics Similar to Yaqui by Divorced or Separated
In terms of divorced or separated, the demographic groups most similar to Yaqui are Immigrants from Nicaragua (13.3%, a difference of 0.010%), Blackfeet (13.3%, a difference of 0.21%), Spanish American (13.3%, a difference of 0.23%), Tsimshian (13.3%, a difference of 0.26%), and Haitian (13.3%, a difference of 0.28%).
| Demographics | Rating | Rank | Divorced or Separated |
| French American Indians | 0.0 /100 | #307 | Tragic 13.2% |
| Ottawa | 0.0 /100 | #308 | Tragic 13.2% |
| Americans | 0.0 /100 | #309 | Tragic 13.2% |
| Africans | 0.0 /100 | #310 | Tragic 13.2% |
| Sioux | 0.0 /100 | #311 | Tragic 13.2% |
| Blackfeet | 0.0 /100 | #312 | Tragic 13.3% |
| Immigrants | Nicaragua | 0.0 /100 | #313 | Tragic 13.3% |
| Yaqui | 0.0 /100 | #314 | Tragic 13.3% |
| Spanish Americans | 0.0 /100 | #315 | Tragic 13.3% |
| Tsimshian | 0.0 /100 | #316 | Tragic 13.3% |
| Haitians | 0.0 /100 | #317 | Tragic 13.3% |
| Cree | 0.0 /100 | #318 | Tragic 13.4% |
| Puget Sound Salish | 0.0 /100 | #319 | Tragic 13.4% |
| Cajuns | 0.0 /100 | #320 | Tragic 13.4% |
| Cheyenne | 0.0 /100 | #321 | Tragic 13.4% |